|
||
|
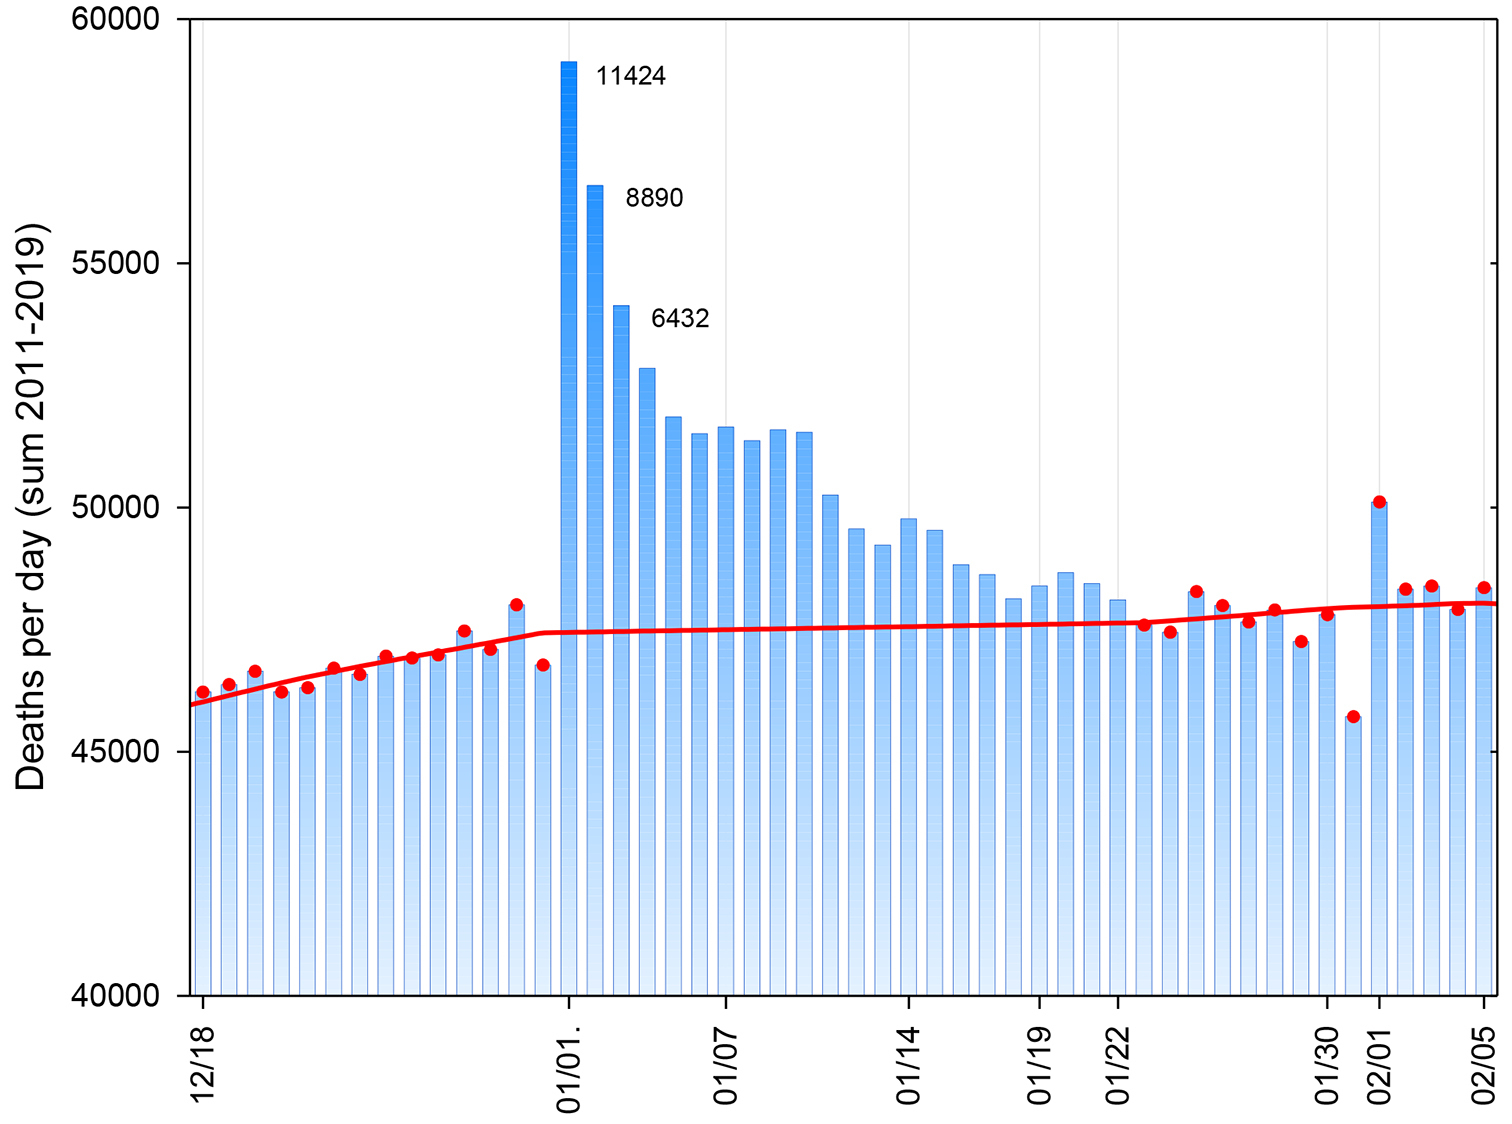
The daily number of deaths in Russia from December 18 to February 5, the sum of indicators for 2011–2019 (blue bars) non-holidays and the LOWESS moving average extrapolated to holidays (red line). Note: Non-holidays are marked with red dots. Major holidays, as well as the end of the excess mortality period (January 22) are marked with dotted lines and the date on the abscissa. The numbers on the graph correspond to the excess deaths estimates for January 1–3. Source: authors’ calculations based on modelling and Rosstat data. |