|
||
|
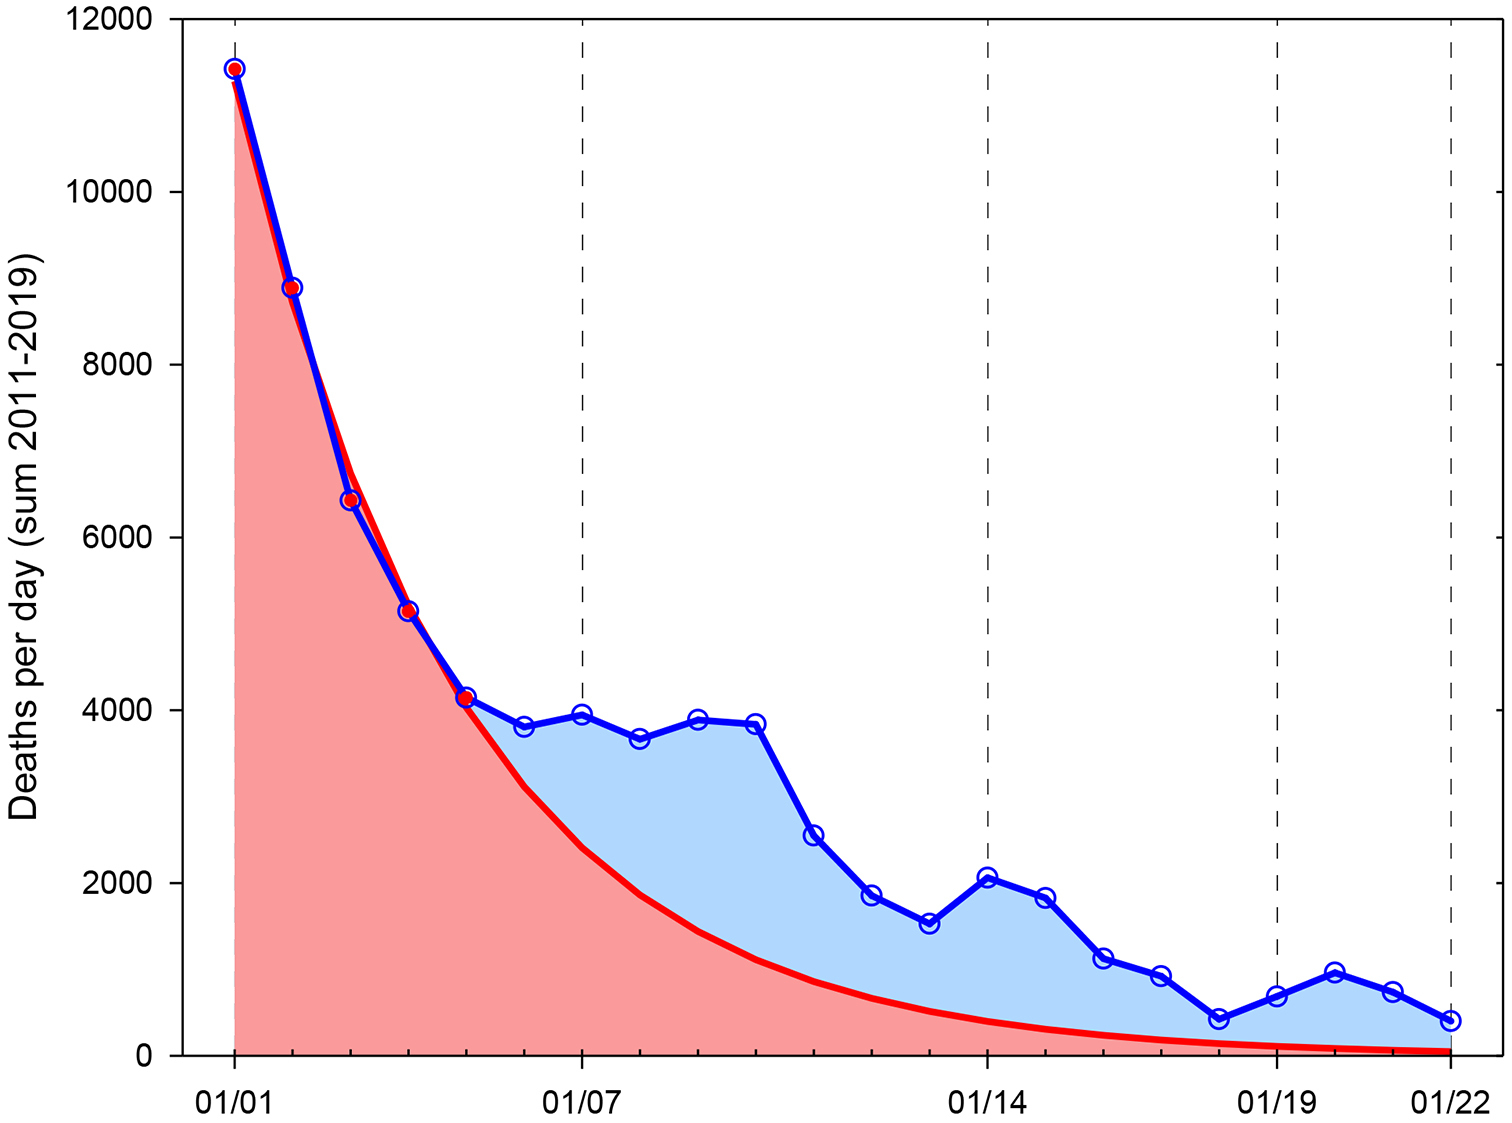
Structure of excess deaths on January 1–22, depending on the holiday, sum of indicators for 2011–2019. Note: The blue line shows the dynamics of the total number of deaths, the red line is the exponent plotted for January 1–5 (days are marked with red dots on the line). The red field is excess mortality due to the New Year, the blue field is excess mortality due to the other three holidays. The moving average LOWESS is taken as the zero mark on the ordinate axis. Source: authors’ calculations based on modelling and Rosstat data. |