|
||
|
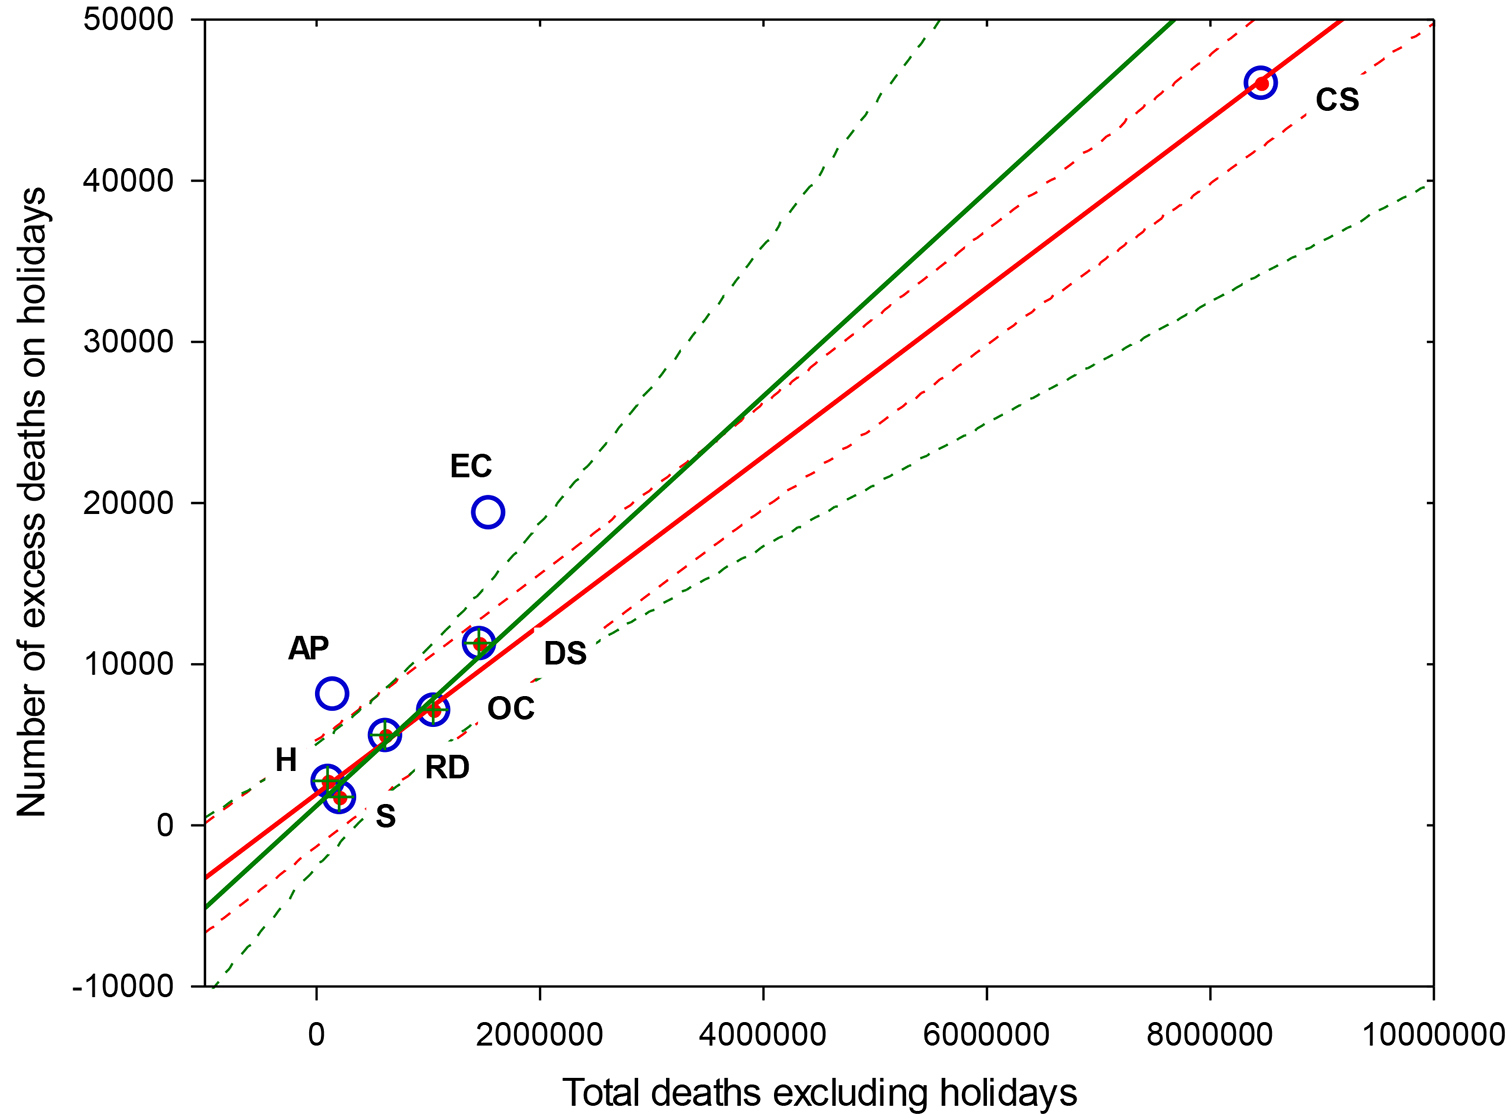
Ratio of excess and total mortality for certain classes of causes of death. Note: CS — diseases of the circulatory system, RD — diseases of the respiratory system, DS — diseases of the digestive system, EC — all external causes, AP — alcohol poisoning, H — homicides, S — suicides, OC — other external causes. Blue circles in the diagram indicate all eight classes of causes of death, red dots indicate a set of causes without EC and AP (red regression line), crosses — a set of causes without CS, EC, and AP (green regression line). The dotted lines represent the 95% confidence intervals. Source: authors’ calculations based on modelling and Rosstat data. |