Data Paper |
|
Corresponding author: Aleksey E. Shchur ( aschur@hse.ru ) © 2023 Aleksey E. Shchur, Sergey A. Timonin, Elena V. Churilova, Egor V. Sergeev, Vera V. Sokolova, Olga A. Rodina, Bulat A. Shamsutdinov, Dmitry A. Jdanov, Vladimir M. Shkolnikov.
This is an open access article distributed under the terms of the Creative Commons Attribution License (CC BY 4.0), which permits unrestricted use, distribution, and reproduction in any medium, provided the original author and source are credited.
Citation:
Shchur AE, Timonin SA, Churilova EV, Sergeev EV, Sokolova VV, Rodina OA, Shamsutdinov BA, Jdanov DA, Shkolnikov VM (2023) Russian Short-Term Mortality Fluctuations Data Series. Population and Economics 7(3): 188-197. https://doi.org/10.3897/popecon.7.e114628
|
Abstract
The COVID-19 pandemic has revealed significant gaps in the coverage and quality of the existing international and national statistical surveillance systems. The most reliable approach to estimating mortality associated with short-term risk factors or factors fluctuating within calendar years is based on estimating weekly excess mortality. Although this approach is obvious, its application turned out to be problematic due to the lack of reliable data. In response to this challenge, a new Short-Term Mortality Fluctuations (STMF) data series was created in 2020. The Russian Short-Term Mortality Fluctuations Data Series (RuSTMF) is a further development of the STMF idea at the regional level. It contains weekly crude and standardized death rates for the Russian regions and Russia as a whole. The main source for calculating death rates is depersonalized individual data on the deceased provided by the Rosstat. This database provides for the analysis of short- and medium-term changes in mortality in males, females and total population in Russia as a whole and its regions, as well as the estimation of «excess» deaths during short-term sharp increases in mortality due to, for example, heat or cold waves, seasonal influenza epidemics, the Covid-19 pandemic or technogenic catastrophes.
Keywords
demographic databases, regions of Russia, excess mortality, short-term mortality fluctuations
Introduction
The impact of intra-annual fluctuations in mortality associated with short-term risk factors (e.g. influenza epidemics, heat or economic crises) is increasing, particularly due to population ageing, general mortality decline and climate change (
In May 2020, three months after the onset of the coronavirus pandemic, the Human Mortality Database (HMD) project team launched a new open-source database containing weekly death counts and death rates from 38 countries: Short-term Mortality Fluctuation (
Regional differences in mortality in Russia during the COVID-19 pandemic, due to a high heterogeneity of the territory, population and their health status, have attracted much attention of researchers (Scherbov at al. 2022;
In contrast to annual death rates, the use of weekly death rates provides a highly accurate timeframe for short-term mortality increases and estimates of excess mortality. Figure

Week-specific age-standardized death rates and excess death rates for Russia as a whole, Moscow and the Republic of Tatarstan in 2020 (left panel) and 2021 (right panel). Source: The figure is derived from the RuSTMF visualization toolkit available at https://mlinz.shinyapps.io/RosBKS/.
Comparing weekly death rates in Moscow, Tatarstan and Russia, we can see, among other things, the overlap of mortality increases associated with the COVID-19 pandemic and summer mortality peaks, apparently caused by heat waves, in Moscow and Tatarstan in 2021 (peak in week 25) and in Tatarstan in 2020 (peak in week 27).
Therefore, the creation and publication of an open-access database on short-term mortality fluctuations in the regions of Russia is a feasible task.
As part of the project «Monitoring and forecasting life expectancy based on operational statistics» (HSE University), the staff of the HSE International Laboratory for Population and Health Research, in collaboration with the HSE Institute of Demography and the School of Demography of the Australian National University, have developed the Russian Short-Term Mortality Fluctuations Data Series (RuSTMF) in 2023. RuSTMF contains crude and age-standardized mortality rates for the regions of Russia and the country as a whole for every week of the year from 2000 to the end of 2021. The RuSTMF methodology is based on the STMF methodology (
Data format and access
The Russian Short-Term Mortality Fluctuations data series contains a series of weekly crude and standardized death rates for men, women and both sexes for Russia as a whole and its regions for the period from 2000 to 2021 in a text file in .csv format. This format allows the files to be easily uploaded to any statistical software.
All indicators are calculated using depersonalized individual data on deaths provided by the Russian Federal State Statistics Service (Rosstat). Period covered: at the time of publication: 03.01.2000 - 31.12.2021, deaths were recorded according to the date of occurrence of the event.
The data are available free of charge from the website of the HSE International Laboratory for Population and Health Research (Russian Short-Term Mortality… 2023). The link to the visualization toolkit can be found in the «Visualization» section of the Russian Short-Term Mortality Fluctuations Data Series (https://mlinz.shinyapps.io/RosBKS/).
Database Structure and Variable Description
Each entry (row) in the data file contains death rates for the specified calendar year, week, territory and sex. If the indicator cannot be calculated for a combination of year, sex and territory, ‘NA’ replaces the corresponding indicators in the data file. The variables included in the database are described in Table
Variables in the Russian Short-Term Mortality Fluctuations data series (file «RuSTMF.csv»)
| Headings | Description and comments |
| PopCode | Territory code. |
| Year | Year |
| Week | Week of the year |
| Sex | Sex (F – female, M – male, B – both sexes combined) |
| CDR | Crude death rate |
| SDR | Standardized death rate |
Methodology
The development of the RuSTMF is primarily based on the STMF methodology (
Input data
The input data for the construction of RuSTMF and calculation of weekly crude and standardized death rates were the mid-year population of Russia and its regions in 2000-2021 and the database of depersonalized data on the deceased, provided on request by the Federal State Statistics Service.
The source of data on the mid-year population in the regions of Russia in 2000-2021 was the Russian Fertility and Mortality Database (2023).
The depersonalized data on the deceased provided by the Russian Federal State Statistics Service served as the data source for calculating the number of deaths in each week of the year, starting from the first week of 2000 and ending with the 52nd week of 2021. The depersonalized data contain information on each death registered by the Russian civil registry office in a given year. This information includes, among others, the date of death (day, month, and year), the date of death registration (day, month, and year), age, sex, region of death.
For 2000-2021, deaths with unknown date of occurrence (unknown year, month or day) accounted for about 0.3% of all deaths and were excluded from the calculation of weekly death rates.
Distribution of deaths by week of the year
The distribution of deaths by week of the year was defined according to the guidelines of ISO 8601-2004 (National Standard… 2018). This defines a calendar week as “a period of seven calendar days beginning on a Monday”. The week number has been defined as follows: “an ordinal number identifying a calendar week within its calendar year according to the rule that the first calendar week of a year is the week containing the first Thursday of that year and the last calendar week of a calendar year is the week immediately preceding the first calendar week of the next calendar year” (Data elements… 2004).
The first week of a calendar year usually includes several days (and deaths) from the last week of the previous year or may not include several days of the current year (i.e. starting on January 2d or 3d). Accordingly, some years include several days of the following year. A year consists of 52 or 53 weeks. In the period from 2000 to 2021 there are 4 years with 53 weeks: 2004, 2009, 2015 and 2020.
Thus, for Russia and its regions (within the administrative borders of the country that were at the time of each reporting year), weekly death counts for men, women and the entire population from week 1, 2000 to week 52, 2021 were calculated (03.01.2000 – 12.31.2021).
Calculation of weekly death rates
The demographic coefficient is the ratio of the number of events by sex and age in a given period to the number of person-years lived by the same sex and age group in a given period. Thus, the crude death rate in week w is the ratio of the number of deaths in week w to the population in week w:
-
![]() where
where
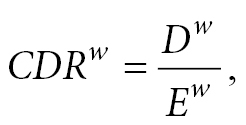
Dw – Number of deaths in week w,
Ew – Number of person-years lived in week w.
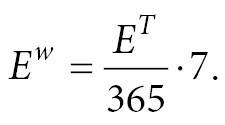
To convert from the mid-year population in year T to the population in week w, it is necessary to divide the mid-year population by 365 and multiply by 7:
However, the use of crude death rates alone for comparisons between areas and over time could distort the true trends and differences in mortality due to differences in the age structure of the populations. In order to eliminate the influence of the age structure of the compared populations on the aggregated death rates, different standardization methods are used.
The direct standardization method ( and the age-specific death rates during the week w
-
![]() where
where
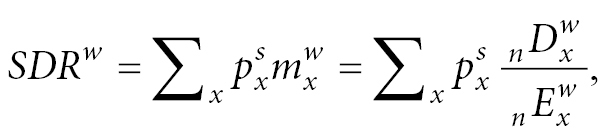
 – Standard population weight for age group x (Eurostat 2013),
 – Age-specific death rates in week w,
 – Number of deaths in week w at age x to x+n,
 – Number of person-years lived in week w at the age of x to x+n.
To calculate weekly standardized death rates, weekly age-specific death rates for five-year age groups (0, 1-4, 5-9, ... 95+) were calculated as the ratio of the number of deaths in week w in age group x to the population in week w in age group x:
The 2013 European Standard Population (Eurostat 2013) was used as the standard population. As a result, standardized death rates were obtained for each week of each year, starting from week 1 in 2000 and ending with week 52 in 2021, for men, women and both sexes by region of Russia and Russia as a whole (Figure

Weekly crude (CDR) and standardized (SDR) death rates in Russia, per 1000 population, men and women, 1st week 2000 – 52d week 2021. Source: The figure is derived from the Russian Short-Term Mortality Fluctuations data series available at https://demogr.hse.ru/russtmf (file “RuSTMF.csv”).
Spatial coverage
The crude and standardized death rates for 2000-2021 presented in the RuSTMF refer to the territorial units of Russia according to the administrative-territorial division used by Rosstat for the given year. The regions of Russia are identified by the territorial codes (so-called ОКАТО codes) used by Rosstat. The availability of data by region fully reflects the availability of data in official statistics.
Scope of application
The Russian Short-Term Mortality Fluctuations Data Series is intended for specialists engaged in professional analysis of demographic processes, and may also be useful to anyone interested in the analysis of mortality of the population of Russia and its regions, including sociologists, economists, epidemiologists, geographers, etc. The data make it possible to analyze short- and medium-term mortality trends, their intra-annual fluctuations, excess deaths due to heat waves, epidemics of infectious diseases (e.g. influenza or corona virus infection).
RuSTMF data would be required by both basic research and executive authorities, particularly in the field of public health. The data series of weekly standardized death rates in Russia and its regions contain unique data on mortality fluctuations both within individual years, since 2000, and between years, opening up new areas of research on the impact of various socio-economic, political, natural and climatic factors on short- and long-term fluctuations in death rates.
In order to popularize and illustrate examples of the use of the Russian Short-Term Mortality Fluctuations data series, a visualization toolkit has been created on the R Shiny platform - https://mlinz.shinyapps.io/RosBKS/. With its help, the user can independently obtain weekly estimates of excess mortality or mortality deficit for Russia as a whole and its regions in 2000-2021 by selecting the target year, the method of estimating the reference level and the reference years. In creating the RuSTMF visualization system, the code used in the Short-Term Mortality Fluctuations visualization system (
References
- Ahmad OB, Boschi-Pinto C et al. (2001) Age Standardization of Rates: A New WHO Standard. GPE Discussion Paper Series 31: 10-12. URL: https://cdn.who.int/media/docs/default-source/gho-documents/global-health-estimates/gpe_discussion_paper_series_paper31_2001_age_standardization_rates.pdf
- Ballester J, Robine J-M, Herrmann FR, Rodó X (2011) Long-term projections and acclimatization scenarios of temperature-related mortality in Europe. Nature Communications 2: 358. https://doi.org/10.1038/ncomms1360
- Ballester J, Robine J-M, Herrmann FR, Rodó X (2019) Effect of the Great Recession on regional mortality trends in Europe. Nature Communications 10: 679. https://doi.org/10.1038/s41467-019-08539-w.
- Gardner JL, Amano T, Sutherland WJ, Clayton M, Peters A (2016) Individual and demographic consequences of reduced body condition following repeated exposure to high temperatures. Ecology 97(3): 786–95. https://doi.org/10.1890/15-0642.1
- Islam N, Shkolnikov V, Acosta R, Klimkin I, Kawachi I et al. (2021) Excess deaths associated with covid-19 pandemic in 2020: age and sex disaggregated time series analysis in 29 high income countries. BMJ 373. https://doi.org/10.1136/bmj.n1137
- Jdanov D, Galarza AA, Shkolnikov VM, Jasilionis D, Németh L, Leon DA, Boe C., Barbieri M. (2021) The short-term mortality fluctuation data series, monitoring mortality shocks across time and space. Scientific Data 8: 235. https://doi.org/10.1038/s41597-021-01019-1
- Ledberg A (2020) A large decrease in the magnitude of seasonal fluctuations in mortality among elderly explains part of the increase in longevity in Sweden during 20th century. BMC Public Health 20: 1674. https://doi.org/10.1186/s12889-020-09749-4
- Makarova M, Pyshmintseva О (2021) Excess mortality in Russian regions during the COVID-19 pandemic. R-economy 7(4): 225–34. https://doi.org/10.15826/recon.2021.7.4.020
- Modig K, Ahlbom A, Ebeling M (2021) Excess mortality from COVID-19: weekly excess death rates by age and sex for Sweden and its most affected region. European Journal of Public Health 31(1): 17–22. https://doi.org/10.1093/eurpub/ckaa218
- Németh L, Jdanov DA, Shkolnikov VM (2021) An open-sourced, web-based application to analyze weekly excess mortality based on the Short-term Mortality Fluctuations data series. PLoS ONE 16(2): e0246663. https://doi.org/10.1371/journal.pone.0246663
- Nikitin BV, Zamyatina NY (2023) Waves of the COVID-19 Pandemic in Russia: Regional Projection. Regional Research of Russia. 13: 271–86. https://doi.org/10.1134/S2079970523700703
- Rau R (2007) Seasonality in human mortality: a demographic approach. Springer, Berlin. URL: https://link.springer.com/book/10.1007/978-3-540-44902-7
- Scherbov S, Gietel-Basten S, Ediev D, Shulgin S, Sanderson W (2022) COVID-19 and excess mortality in Russia: Regional estimates of life expectancy losses in 2020 and excess deaths in 2021. PLoS ONE 17(11): e0275967. https://doi.org/10.1371/journal.pone.0275967
- Timonin S, Klimkin I, Shkolnikov V, Andreev E, McKee M, Leon D (2022) Excess mortality in Russia and its regions compared to high income countries: An analysis of monthly series of 2020. SSM – Population Health 17: 101006. https://doi.org/10.1016/j.ssmph.2021.101006
- Vandoros S (2020) Excess mortality during the Covid-19 pandemic: Early evidence from England and Wales. Social Science & Medicine 258: 113101. https://doi.org/10.1016/j.socscimed.2020.113101
- Woolf S, Chapman D, Sabo R, Weinberger D, Hill L (2020) Excess Deaths From COVID-19 and Other Causes, March-April 2020. JAMA 324(5): 510–13. https://doi.org/10.1001/jama.2020.11787
Other sources of information
Data elements and interchange formats (2004) ISO 8601:2004: Information interchange. Representation of dates and times. URL: https://www.iso.org/standard/40874.html (accessed on: 25.10.2023)
Eurostat (2013) Revision of the European Standard Population - Report of Eurostat’s task force edition. Publications Office of the European Union, Luxembourg. URL: https://ec.europa.eu/eurostat/web/products-manuals-and-guidelines/-/ks-ra-13-028
Eurostat: Deaths by week – special data collection. URL: https://ec.europa.eu/eurostat/cache/metadata/en/demomwk_esms.htm (accessed on: 25.10.2023)
Excess and Exiguous Deaths Dashboard in Japan. URL: https://exdeaths-japan.org/en/ (accessed on: 25.10.2023)
National Standard of the Russian Federation (2018) GOST R 7.0.64-2018: System of standards on information, librarianship and publishing. Representation of dates and times. General requirements. URL: https://docs.cntd.ru/document/1200159341#7E20KD (in Russian, accessed on: 26.11.2022)
Russian Fertility and Mortality Database. Center for Demographic Research at the New Economic School, Moscow (Russia). URL: http://demogr.nes.ru/index.php/ru/demogr_indicat/data (data downloaded on [25.10.2023])
Russian Short-Term Mortality Fluctuations database [Data set]. Zenodo. https://doi.org/10.5281/zenodo.10280664 (data downloaded on [25.10.2023]).
Short-Term Mortality Fluctuations. Max Planck Institute for Demographic Research (Germany), University of California, Berkeley (USA), and French Institute for Demographic Studies (France). URL: https://www.mortality.org/Data/STMF (accessed on: 25.10.2023)
Acknowledgments
This paper follows from Strategic Project “Monitoring and forecasting life expectancy based on operational statistics”, which is part of Higher School of Economics’ development program under the “Priority 2030” academic leadership initiative. The “Priority 2030” initiative is run by Russia’s Ministry of Science and Higher Education as part of National Project “Science and Universities”.
The authors would like to thank Evgeny M. Andreev for many years of fruitful cooperation, without which the creation of this database would hardly have been feasible.
Information about the authors
Shchur Aleksey E. – Candidate of Science (PhD) in Economic Sociology and Demography, Research Fellow, International Laboratory for Population and Health, HSE University, Moscow, 101000, Russia. E-mail: ashur@hse.ru
Timonin Sergey A. – Candidate of Science (Ph.D.) in Geography, Research Fellow, School of Demography, The Australian National University, Canberra, 2600, Australia, E-mail: Sergey.Timonin@anu.edu.au
Churilova Elena V. – Candidate of Science (PhD) in Economic Sociology and Demography, Research Fellow, International Laboratory for Population and Health, HSE University, Moscow, 101000, Russia. E-mail: evchurilova@hse.ru
Sergeev Egor V. – Research Assistant, International Laboratory for Population and Health, HSE University, Moscow, 101000, Russia. E-mail: evsergeev@hse.ru
Sokolova Vera V. – Candidate of Science (Ph.D.) in Geography, Junior Research Fellow, International Laboratory for Population and Health, HSE University, Moscow, 101000, Russia. E-mail: vsokolova@hse.ru
Rodina Olga A. – Research Assistant, International Laboratory for Population and Health, HSE University, Moscow, 101000, Russia. E-mail: oarodina@hse.ru
Shamsutdinov Bulat A. – Research Assistant, International Laboratory for Population and Health, HSE University, Moscow, 101000, Russia. E-mail: bashamsutdinov@hse.ru
Jdanov Dmitry A. – Candidate of Science (Ph.D.) in Physico-Mathematical Sciences, Chief Research Fellow, International Laboratory for Population and Health, HSE University, Moscow, 101000, Russia. E-mail; dzhdanov@hse.ru Head of the Laboratory of Demographic Data, Laboratory of Demographic Data, Max Planck Institute for Demographic Research, 18057, Rostock, Germany E-mail: jdanov@demogr.mpg.de
Shkolnikov Vladimir M. – Candidate of Science (PhD) in Geography, Academic Supervisor, International Laboratory for Population and Health, HSE University, Moscow, 101000, Russia. E-mail: vmshkolnikov@hse.ru. Guest Researcher, Laboratory of Demographic Data, Max Planck Institute for Demographic Research, 18057, Rostock, Germany E-mail: shkolnikov@demogr.mpg.de