|
Corresponding author: Dmitry V. Pomazkin ( d.pomazkin@gazfond.ru ) © 2019 Dmitry V. Pomazkin.
This is an open access article distributed under the terms of the Creative Commons Attribution License (CC BY 4.0), which permits unrestricted use, distribution, and reproduction in any medium, provided the original author and source are credited.
Citation:
Pomazkin DV (2019) Dynamics of life expectancy in Russia over the last half century and prospects of reaching the 80+ level by 2030. Population and Economics 3(2): 22-28. https://doi.org/10.3897/popecon.3.e37964
|
Abstract
The article analyzes the possibility of achieving life expectancy of 80 years by 2030 on the basis of actual data on life expectancy in the Russian Federation during the last 50 years and changes in age-specific death rates.
Keywords
life expectancy forecast, rate of decline in mortality
Since 2006, the Russian Federation has experienced a steady growth in life expectancy, far exceeding the growth rate in other countries. The average growth rate of life expectancy in many countries, including Europe, the USA, Japan is about 1 year of age within 5 calendar years. The documents shaping of the population policy in the Russian Federation set targets for the total life expectancy (TLE, ex). By 2025 the TLE should reach 78 years (
This paper analyzes historical data for the last decades. Fig. 1 shows Rosstat data on life expectancy at birth for over 60 years. The trend has changed after 2006, and in some periods life expectancy of men was increasing by almost a year of age within one calendar year. In European countries, within the last 50 years the increase in life expectancy by 1 year of age occurred within over 5 calendar years on average. In Russia, life expectancy at birth (e0) has increased between 2011 and 2017 by 2.46 years for the total population (from 70.24 to 72.70 years): by 2.95 years in men (from 64.56 to 67.51 years), in women - by 1.78 years (from 75.86 to 77.64 years). The difference in life expectancy between men and women decreased from 11.30 in 2011 to 10.13 years in 2017.

Life expectancy at birth in Russia. Source: Rosstat: http://www.gks.ru/wps/wcm/connect/rosstat_main/rosstat/ru/statistics/population/demography/.
The results of the TLE forcasting for men and women are shown in Fig. 2. The target values set by population policy documents are used as benchmarks: they are higher than the values of the average Rosstat’s forecast. For comparison, Fig. 2 shows the data on the TLE for the United States, where an amount comparable with the GDP of the Russian Federation (1.5 trillion USD) is annually spent on palliative care, although such patients account for only 5% of the total numbers (

Life expectancy forecast. Sources: Rosstat; https://www.cia.gov/library/publications/resources/the-world-factbook/geos/us.html.
A natural question arises: by what rate should mortality be reduced to reach the target values in life expectancy? Fig. 3 shows the calculated e0 (TLE at birth) over time (X-axis) for men and women, depending on the annual rate of decline in mortality at each age (Y-axis). This forecast is calculated by the author on the basis of smoothed life tables of the Russia’s population for 2017. It can be seen that achieving the e0 value of 80 years in 2030 is possible at a rate of mortality decline of 4.5%, which is higher than the current rate shown in Fig. 3.

Life expectancy (e0) depending on the annual rate of decline in mortality: a) the field of e0 values; b) the geometric mean of decline in mortality depending of the age in 2007-2017. Source: calculations of the author, Rosstat.
Of course, the assumption of the same rate of decline in mortality at each age is conditional, but this approach allows to estimate the sensitivity of e0 to age changes in the probability of death. It may be advisable to use more complex hypotheses for the age profile of changes in the probability of death. However, for estimative calculations, the proposed approach seems appropriate, as it significantly simplifies analysis of results and reduces the risk of additional errors. For example, the Society of Actuaries of the U.S. in order to model the effect of reducing mortality, the expected rate of decline in mortality for men and women is assumed at 1% per year in the age range of 0-85 followed by a linear decrease to 0% (
According to the data shown in Fig. 3, the average geometric rate of mortality reduction in the Russian Federation during 2007-2017 strongly depends on age and is described by a complex non-monotonous function. However, in 60+ ages, where death rates most significantly affect life expectancy, the annual rate of decline is between 2 and 3%. Therefore, if the current profile of the rate of reduction of mortality by age will not change, it is impossible to achieve TLE at birth of 78 years in 2024 and 80 years in 2030.
In addition, it should be noted that in order to maintain the linear growth rate of TLE, the rate of decline in mortality must increase. In other words, linear dependence disappears over time; this means that there is another limitation related to the requirement of increasing the rate of mortality reduction (this effect is manifested at high values of e0 and can be associated with approaching the age limit).
If we divide age into two parts - up to 50 years and over, and look at the contribution of mortality changes in these age groups to life expectancy at birth, it turns out that in women, when mortality is reduced by 80% (annual rate of decline of 15% per year within10 years) in ages under 50, and in the absence of reduction in mortality in ages over 50, e0 increases by 2.4 years and by 5.3 years in men. According to the life table for 2017, in the Russian Federation life expectancy at birth in women is 77.6 years, in men — 67.5 years. Therefore, in the absence of reduction in mortality after 50 years and in the case of reduction by 80% in all ages under 50 years, life expectancy of women will be 80 years, hence the increase is 80-77.6=2.4 years. Similarly, the increase in life expectancy for men is calculated. Fig. 4 shows life expectancy values depending on mortality reduction (in per cent). The reduction of mortality in ages over 50 years is marked along the X-axis, and in ages under 50 years is marked on the Y-axis. Life expectancy at the same rate of decline in mortality at all ages corresponds to the diagonal.

Life expectancy (e0) (a) of women and (b) men in the Russian Federation depending on the change in mortality in the ages under and over 50 years. Source: calculations of the author
Assuming that the annual rate of decline in mortality over the next 10 years will not change, at 4-5% per year for women under 50 years, after 50 - 2-3% and at 5-6% and 2-3% for men respectively, the mortality rate for women under 50 years of age will decrease by 34-40%, after 50 - by 20-25%, for men under 50 years of age - by 40-45%, after 50 - by 20-25%. Thus, the maximum life expectancy for women in 10 years can be 81 years, for men - 73 years, the arithmetic mean will be 77 years, and in 2030 for women the maximum life expectancy may be 82 years, for men - 75 years, and the arithmetic mean is 78.5 years. Despite the rough calculation, this approach provides some estimate for the target.
In addition, when choosing long-term benchmarks, it is necessary to consider the effect associated with the trend direction, in other words, the derivative sign. The change in mortality in 2017 exceeds the average of mortality reduction in almost all ages, but this does not allow for revision, as the expected increase ex in 2018 is much less than in the record 2017.
It should be noted that the decline in mortality was observed not so long ago. During the 1990s in the Russian Federation, there were periods of strong (extreme) growth in death rates. Minimum life expectancy values were recorded in 1994. In some ages, the increase in death rates exceeded 30%. Heat maps (Fig. 5) show annual percentage changes in mortality in the Russian Federation, depending on age, since 1990.

Heat maps of the annual change in death rates for (a) men and (b) women in the Russian Federation. Source: calculations of the author
Let’s consider a way to estimate the change in age-specific death rates over time. To do this, let’s compare the probabilities of death at each age for a given period of time.
The probability of dying at age (x) per year (t) is calculated by the formula
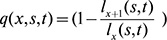 ,
,
where lx (s,t) is the number of those of sex s who live to age x, according to the life table in year t.
The change in probability of death for a year is defined as follows:
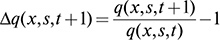 .
.
Then, projecting the obtained value, expressed as a percentage, on the time-age plane, we get the field of mortality for a certain sex. The vertical scale is the percentage change in the probability of death. Red reflects an increase in the probability of death, yellow indicates a decrease. The background colour applies to annual percentages of mortality fluctuation in the +/- 2% range, which corresponds to the average positive and negative values of percentage changes in death probabilities.

Life expectancy in Russia in 2017 for (a) women and (b) men depending on age. Source: calculations of the author
Values of life expectancy (ex) for men and women depending on age and time for the population of the Russian Federation show TLE growth in all ages since 2006, which confirms the bend of isolines observed in 2017. TLE in men is more likely to fluctuate than in women.
It is important to note that there are regional differences for the ex (t) function. For example, for the population of the city of Moscow, the growth of life expectancy in men begins 2 years earlier than in the Russian Federation, and for women, there is almost monotonous growth ex after its sharp fall in the 1990s (Fig. 7).

Conclusions
The presented materials show trends in mortality reduction and increase in life expectancy in the Russian Federation. If the rate of decline in mortality over the past 10 years does not change, by 2030 life expectancy of 80 years cannot be achieved for the hypothetical generation because of the following factors:
- an insufficient rate of decline in mortality: it must be at 4-5% per year in order to achieve the targets, which is higher than the existing values of 3-4% for ages 30+ and 2% for ages 80+;
- the exhaustion of the “low base level” effect, where increases in the non-linear relationship between mortality and influencing factors can significantly slow down the growth of life expectancy;
- a disparate level of expenditure on health care with countries with a life expectancy of 80 years or more.
To build a more reliable predictive estimate, the mortality model of the Russian population should be considered within the framework of the general model of sociodynamics, which takes into account the influence of external factors on the level of age probabilities of death.
Reference list
- Ukaz Prezidenta RF №204 ot 7.05.18 “O nacional’nyh celjah i strategicheskih zadachah razvitija RF na period do 2024 goda” [Decree of the President of the Russian Federation of 07.05.18 № 204 “On national goals and strategic objectives of development of the Russian Federation for the period up to 2024”] [in Russian]
- Poslanie Prezidenta Federal’nomu sobraniju [Presidential Address to the Federal Assembly], 01.03.2018 http://kremlin.ru/events/president/news/56957 [in Russian]
- Kalyanina L (2018) Teplyj plashh dlja pacienta [Warm cloak for the patient]. Expert 46 (1097). [Digital resource] URL: https://expert.ru/expert/2018/46/teplyij-plasch-dlya-patsienta/ [in Russian]
- Mortality improvement scale. Society of Actuaries (2017) [Digital resource] URL: https://www.soa.org/resources/experience-studies/2017/mortality-improvement-scale-mp-2017/
- Materials of the Mortality Working Group of the International Actuarial Association [Digital resource] URL: https://www.actuaries.org/IAA/IAA/Committees/Scientific/Mortality_Working_Group.aspx?WebsiteKey=ff59269c-4928-4369-a169-03e74a6bd8ca&CommitteeTabs=3#CommitteeTabs.
- Data from the websites: www.gks.ru, www.mortality.org, www.infoarchives.ru/demography
Authors information
Dmitry V. Pomazkin, PhD in Economics, Actuary in the Non-governmental Pension Fund “Gazprombank-fund”. E-mail : D.Pomazkin@gazfond.ru