|
Corresponding author: Ekaterina R. Barkova ( kulakovakateriina@gmail.com ) © 2021 Ekaterina R. Barkova.
This is an open access article distributed under the terms of the Creative Commons Attribution License (CC BY 4.0), which permits unrestricted use, distribution, and reproduction in any medium, provided the original author and source are credited.
Citation:
Barkova ER (2021) Socioeconomic determinants of demographic development of the Yamalo-Nenets Autonomous Okrug. Population and Economics 5(1): 1-19. https://doi.org/10.3897/popecon.5.e57105
|
Abstract
The study explores the peculiarities of demographic processes in the Yamalo-Nenets Autonomous Okrug and the socioeconomic factors determining them. The author tests hypotheses about the relationship of socioeconomic characteristics of the population with fertility and migration basing on data from 13 municipalities of the region for 2011–2017. The analysis reveals a statistically significant relationship between age-specific fertility rate for women aged 15–49 and such indicators as marriage and divorce rates, wages, the proportion of employed in the working-age population, the enrolment of children in preschool education, and the proportion of families who received housing or improved housing conditions among those registered in the housing program. Inbound migration rate is statistically related to wages, as well as to proportion of employed in the total working-age population, while outbound migration rate is linked to proportion of those employed in mining, as well as to indicators characterizing situation in the marriage market.
Keywords
Yamalo-Nenets Autonomous Okrug, demographic development, socioeconomic factors, fertility, migration
Introduction
In the context of the large-scale development of the Arctic zone of Russia, issues of demographic development of the northern regions, which are important both as resource areas and geopolitically, gain high significance. The Yamalo-Nenets Autonomous Okrug (YaNAO) is an integral part of the Arctic, and this region is characterized by one of the highest per capita gross regional product (GRP) in the country, as well as by high level of budgetary provision. These features allow directing significant resources to solving development problems in the region, a necessary prerequisite for which is its stable demographic reproduction. Currently, in all municipalities of the YaNAO, there is a shortage of labour resources, the most realistic way of compensating for which, given special the needs of the region’s economy in the working-age population, is to attract temporary labour migrants. At the same time, there are tasks to maintain a positive migration balance in exchange with other regions, to prevent the decline in the total population, as well as to maintain natural population growth. All these tasks actualize the issue of finding new approaches to the implementation of regional demographic policy.
The main purpose of this study is to identify the socioeconomic factors of demographic development in the Yamalo-Nenets Autonomous Okrug. In the first part of the article, the author analyzes modern empirical works in the field of fertility and migration modeling, and then, based on their results, formulates and tests the following hypotheses:
- the fertility rate in the municipalities of YaNAO is influenced by indicators such as wages, the proportion of employed in the working-age population, the enrolment of children in preschool education, marriage and divorce rates, and indicators characterizing the housing market;
- labour market indicators in the municipalities of the YaNAO — wages, the proportion of employed in the working-age population, the structure of the local economy, and situation on the housing market — affect population inflows and outflows.
The relationships revealed in the study and the proposed interpretation of the obtained results might contribute to the development of new measures of social and demographic policy.
Fertility studies
Within the macroeconomic approach, fertility theories are based on the factor–phenomenon logic and aim at determining mainly socioeconomic factors that influence fertility.
The macroeconomic approach is rather diverse due to the significant number of factors potentially affecting fertility dynamics. In general, scholars distinguish global (urbanization, growth of population mobility, industrialization) and local determinants (income levels, employment, education, housing, etc.).
Gary Becker (
Becker’s ideas were elaborated in the works of Richard Easterlin (
The link between women’s education and fertility has also been studied thoroughly, and there is no consensus on this issue. According to Becker’s ideas, women with high levels of education postpone the decision to have children for economic reasons. However, some studies show a positive link between women’s education and fertility rates. Behrman and Rosenzweig’s paper (
Another controversial issue is the direction of the link between marriage rates and fertility levels. If Becker’s model considers the family as a sustainable element, later studies (due to the transformation of the value of the institution of the family) are devoted to the factor of the spread of unregistered partnerships (
Summing up, we can highlight the main world trends in fertility, which are characteristic of the sociodemographic process that has been gaining momentum for over a decade, the second demographic transition. Firstly, it is a dramatic decline in the number of children in the family This fairly stable trend is due to the development of health care systems (reduction in infant and child mortality), freedom to choose a partner and form of cohabitation, spread of birth control methods, and development of public pension systems in which children have ceased to be regarded as a source of income and support in old age. Secondly, it is a shift to a new fertility model, where the contribution of older age groups to fertility increases. This shift could be explained by the increasing time of education, the increasing role of women in the labour market, and more equitable remuneration for women; however, there is no clear answer to the question of the link between women’s education, employment and fertility processes.
These trends are also relevant for Russia: in recent decades we have seen a decline in the number of children in the family, postponement of first births to later ages, an increase in the number of unregistered partnerships.
The body of domestic studies devoted to the dynamics and factors of fertility in Russia is rather large.
For example, a monograph by Vladimir Arkhangelsky (Arkhangelsky, 2006) is notable for the fact that the author considers fertility dynamics basing on aggregated data and paying special attention to matrimonial status and indicators reflecting living conditions. A study by Roshina and Boykov (
In the context of this work, studies of fertility factors at the regional level are of special interest. Mironova and Tyrnova (
The majority of the mentioned studies are based on econometric analysis, where various demographic and socioeconomic factors act as explanatory variables.
Migration studies
The factor analysis is also common in the field of migration research. One of the representatives of the factor approach is Everett Lee, who proposes a Push/Pull factor scheme (
Existing studies focusing on separate countries or areas make it possible to identify the most frequent factors influencing migration.
Mulhern and Watson’s study (
Napolitano and Bonasia (
In Ghatak’s paper (
Chen and Coulson carried out a study of urban migration in China (
In Russia, the study (
In Gerber’s later work (
In Aleshkovsky’s study (
In (Berger et al. 2008), the authors assessed the quality of life in Russian cities and analyzed compensating differences in wages and housing prices. The empirical basis for the study was RLMS data. Using the MLS method, the researchers found a positive correlation of the obtained urban quality of life indices with regional net migration growth rates.
The analysis of interregional migration flows based on Russian data from 1990 to 2006 in the work Interregional migration: an equilibrium approach by Oshchepkov showed that regional migration indicators are influenced not only by wages and unemployment rates, but also by their dynamic effects. This study confirms the conclusions of a number of previous works on the impact of differences between regional labour markets, climatic conditions, regional infrastructure indicators on migration flows between regions (cit. by
In the paper (
Thus, the bulk of the work on factor analysis of migration shows the importance of labor market indicators (wages, unemployment rate), as well as the provision of housing. Indicators of health, education, infrastructure, environment in the region, as well as industry specificity are often used as control variables in these studies.
Research on Russian data, however, has a number of disadvantages.
First of all, many studies fail to take into account the change in the methodology of accounting for migrants in 1995 and 2011, as a result of which the obtained estimates might be invalid. Unfortunately, including dummy variables in the model does not always solve this issue.
Another problem is the heterogeneity of Russian regions. The inclusion of control variables assumes that all factors have the same effect on migration in each region, which is unlikely. There are a number of papers in which authors divide regions into clusters according to differences in migration rates; however, specific factors for each of these clusters are not singled out. This predetermines the demand for special demographic studies at regional level.
Finally, most of the mentioned studies are based on regional data. No quantitative studies were found on data from municipalities in individual regions. At the same time, local labor markets and other indicators may have their own specificity, different from the regional one.
In this study, when modeling migration processes in the YaNAO, author attempts to take into account these remarks.
The demographic situation in the Yamalo-Nenets Autonomous Okrug
The formation of the modern population structure of the region took place during the 1970–1980s and was closely associated with the tasks of developing the rich resources of the region’s oil and gas complex. At the beginning of the 21st century, the population of the YaNAO exceeded 0.5 million people for the first time. At present, the demographic situation in the YaNAO is promising compared to other regions of the Russian Federation. The absolute number of the population has been increasing over the past years, primarily due to natural growth (Fig.

Components of population change of the YaNAO for 2000–2018. Source: compiled by the author according to Rosstat data
The YaNAO is characterized by low population density (0.71 people per 1 square km), high level of urbanization, concentration of population in large cities (40% of the population live in the cities of Novy Urengoy and Noyabrsk, and another share of over 40% in the remaining 6 cities), and by significant transport remoteness of thinly populated settlements, especially in rural areas.
Generally, the population of Yamal can be divided into three categories:
- those living in cities (mostly people who have come to work and remain permanent residents for quite a long time);
- small indigenous nations of the North, mainly engaged in agriculture (they divide into two types — those living in sparsely inhabited territories, keeping nomadic and semi-nomadic lifestyles, and those living in rural areas and cities);
- population working via shift method (approximately 20% of the labour force), short-term migrants, mainly intending to work in the fuel extraction and energy sector of economy.
Assessment of the demographic situation usually bases on the analysis of three main processes — fertility, mortality, and migration. Taking into account the climatic and socioeconomic features of the YaNAO, it can be assumed that mortality rates are significantly distorted by migration. This is because people, having completed their work activities upon reaching a certain age, are most often willing to spend the rest of their days in their historic homeland (the salmon bias) or in places with a more favourable climate. This issue requires special study, and therefore here author eliminates mortality from the analysis and focuses on fertility and migration.
Fertility dynamics
In 2018, crude fertility rate in the YaNAO was 13.4‰, which is significantly higher than average Russian level (10.9‰). This is determined by relatively higher age-specific birth rates and a higher proportion of women of active reproductive age in the population of the region.
Total fertility rate (TFR), which more adequately characterizes the fertility dynamics, since its magnitude does not depend on the characteristics of the age structure of the population, also exceeds average estimates for the country. Fig.

Dynamics of the total fertility rate in the YaNAO and in the Russian Federation in 2000–2018. Source: compiled by the author according to Rosstat data
The main features of the fertility in the YaNAO are as follows:
- relatively young age model of fertility;
- higher, compared to the average for Russia, birth rates due to the powerful demographic resource of previous years and favourable age structure of the population;
- a higher proportion of second and subsequent births (since second and subsequent babies are born to women of relatively older ages, this results in a higher average age of the mother at the birth of the child);
- a decrease in the number of women aged 20 to 30 years, and therefore, the number of births would be reduced if conditions remain unchanged.
In the context of decreasing number of women in active reproductive ages, maintaining natural population growth requires an active demographic policy. To develop such a policy, it is necessary to know the factors affecting fertility and promoting the realization of the reproductive potential of the inhabitants of the region.
Migration dynamics
Migration flows are of high importance in the demographic development of the region. Due to the high variability of migration indicators for municipalities, it is rather difficult to trace the trends, which is why the author of this study considers the overall results for the period of 2012–2018. Over this period, natural population growth in all municipalities was positive — against the background of significant migration losses in almost all regions except for the city of Salekhard and the Gubkinsky district; an increase in the total population number occurred in three urban districts — Salekhard, Gubkinsky, and Novy Urengoy.
In other municipalities, the population for the period 2012–2018 decreased due to the excess of negative migration balance over natural population growth. The most significant decrease in population due to migration outflow was observed in the Noyabrsk, Nadymsky, Purov, Tazovsky and Shuryshkar districts.
In general, for the YaNAO the crude inbound migration rate in 2012 was 82‰, and by 2017 this indicator went down to 65‰. In the municipalities of the district, there is a significant differentiation in the numbers of arrivals per 1,000 population. The highest indicators are noted in the cities of Gubkinsky (100–140‰) and Novy Urengoy (87–130‰). The lowest inbound migration rates were registered in the Yamalsky and Priuralsky districts, in Noyabrsk and Labytnangi (32–50‰, Fig.

Inbound migration rates in YNAO by municipalities, 2012–2017, ‰. Source: compiled by the author according to Rosstat data
The outbound migration rate per 1,000 population for the entire period (2012–2017) outnumbered the inbound and mounted up to 75–97‰. The largest values of these coefficients were noted in Gubkinsky, Novy Urengoy, and Nadymsky district — 80–140‰ (Fig.

Outbound migration rates in YNAO by municipalities, 2012–2017, ‰. Source: compiled by the author according to Rosstat data
In 2012–2017, the YANAO as a whole had a negative migration balance. Particularly significant migration losses occurred in 2013–2015 — rates of depopulation due to migration losses were 11–22‰. Negative migration balances were typical for most municipalities.
The main features of the migration processes in the YaNAO are as follows:
- absolute indicators largely depend on the rules and practices of registration of migrants, and these have changed several times in recent years;
- statistics shows increased intensity of migration flows in both directions;
- most municipalities are characterized by a migration decline in the population;
- outbound migrants mainly head to other regions within the Russian Federation;
- migration exchange with most CIS member States has positive balance;
- the main motives of the inbound migrants in the YaNAO are personal issues, family circumstances, and job search;
- employment in the YaNAO is attractive primarily for migrant workers from neighbouring countries.
Taking into account the existing migration processes, it can be assumed that the migration balance at the YaNAO will remain at the level of recent years, i.e. negative (minus 3–7‰). At the same time, in conditions of labour shortage the region is likely to be forced to attract population from other regions and CIS countries. The shortage of local skilled personnel for the growing challenges of economic development of the region increases the region’s dependence on the influx of highly skilled migrants and shift workers. Migration outflows can be reduced only if there is a favourable situation in the socioeconomic sphere and changes in the sphere of migration policy.
Methodology of construction of the econometric model and calculations
Within this study, author builds models of fertility and migration for the municipalities of the YaNAO. The author evaluates three regression equations based on municipal statistics, in which age-specific fertility rate for women aged 15–49 (1), inbound migration rate (2) and outbound migration rate (3) act as dependent variables. A set of socio-economic characteristics of the territory is included in the list of explanatory variables, and its description is given in Table
| Designation in models | Unit of measurement | Indicator |
|---|---|---|
| SpFR | promille | Age-specific fertility rate |
| MarriageRate | promille | Crude marriage rate |
| DivorceRate | promille | Crude divorce rate |
| Wage | rubles | Average monthly salary of employees of organizations |
| Education | percent | Percentage of children aged 1–6 years receiving pre-school educational services and/or accommodation services in municipal educational institutions in the total number of children aged 1–6 |
| ShareWomenActive | percent | Proportion of women in active reproductive age (25–34 years) in the total number of women of reproductive age (15–49 years). |
| VvedenoZhilya | square meter | Total amount of the newly introduced housing stock in the municipality |
| SquarePP | square meter | Total amount of housing, average per resident |
| FamReceived | percent | Proportion of families who have received accommodation and improved housing conditions during the year among those who are registered for receiving housing |
| ImmigrationRate | promille | Number of inbound migrants per 1,000 population |
| EmigrationRate | promille | Number of outbound migrants per 1,000 population |
| WorkersExtraction | percent | Percentage of those employed under section C “Mining” in the average number of employees of organizations |
| WorkersBuilding | percent | Percentage of those employed under section F “Construction” in the average number of employees of organizations |
| WorkersTransport | percent | Percentage of those employed under section I “Transport and communications” in the average number of employees of organizations |
| EmploymentRate | percent | Employment rate among the working-age population |
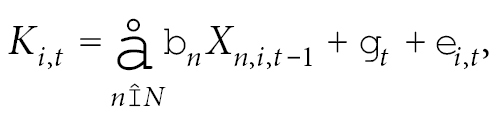 (1)
(1)
where Ki,t is age-specific fertility rate for women aged 15–49 in municipality i in period t in the first model, inbound migration rate — in the second, outbound migration rate — in the third model respectively; Xn,i,t–1 is explanatory variables describing the peculiarities of socioeconomic development of the municipality i during period t-1; βn is the vector of estimated coefficients for the explanatory variables; γt are dummy variables for time periods taking into account the time effect; εi,t are autocorrelated residuals (as an assumption, correlation between residuals in observations relating to municipality i is possible).
Author makes an attempt to eliminate endogeneity in equation (1) by including explanatory variables with a lag, that is, separating regressors and the dependent variable in time. A similar method is used in other studies (Guriev and Andrienko 2006;
Total fertility rate is a more accurate indicator of fertility if compared to crude rate. However, to calculate it, we have to know the age-specific birth rates for all age groups of women in reproductive ages. Due to the scarcity of such data, the age-specific fertility rate for women aged 15–49 has been calculated as a dependent variable (SpfR), which displays the number of births per 1,000 women of reproductive age. The main drawback of this coefficient is that its value depends on the age structure of women in this group. To prevent biased results, we shall introduce the control variable ShareWomenActive — the proportion of women in active reproductive age (25–34 years) in the total number of women of reproductive age (15–49 years).
Author assumes that demographic parameters are always important for reproductive intentions, and therefore includes a marriage rate (MarriageRate) and a divorce rate (DivorceRate) in the model.
The provision of housing is measured by the variable SquarePP — the total area of housing in the municipality per one inhabitant. Also, the situation on the housing market is reflected by the variable VveDenoZhilya, which indicates the total area of residential housing put into use in the municipality (in square meters). Finally, the model includes an indicator showing the situation in the region with social assistance in housing and housing conditions issues — the proportion of families who received accommodation and improved housing conditions in the reporting year among those registered in the housing program (FamReceived).
To assess the availability of places in childcare facilities, the Education variable is used — the gross pre-school enrolment rate, as a percentage of the number of children aged 1–6. The disadvantage of this ratio is that it does not show real demand for pre-school services.
The average monthly salary of employees (Wage) is used to estimate the income level, but due to lack of data, social benefits and other income which could affect the fertility situation are not taken into account. This indicator can be falsely overestimated since it takes into account the salaries of employees coming to work in shifts.
To determine the factors affecting the intensity of migration flows, author uses independent variables ImmigrationRate — arrivals per 1,000 population and EmigrationRate — number of departures per 1,000 population.
In addition to the average monthly wages, author accounts for the structure of the economy of each municipality. For this purpose, the shares of those employed in the main sectors for the YaNAO, such as mining — WorkersExtraction, construction — WorkersBuilding, transport and communications — WorkersTransport were calculated (the ratio of the employees in the sector to the average number of employees in the municipality).
The employment ratio of the working-age population — EmploymentRate — is calculated as a proxy for the level of employment; it is estimated as the ratio of the average number of employees to the number of working-age population. Its disadvantage is that it overestimates the real level of the employed population in the economy, since the average number of employees includes working teenagers and pensioners who are not counted in the working-age population.
The models are estimated basing on statistics from the Database of indicators of municipal formations for 13 municipalities of YaNAO for 2011–2017. Data for later periods in the database for some variables are not available, which justifies the selected time period. Statistics characterizing dependent variables cover the period 2012–2017, and regressors cover 2011–2016. In connection with Rosstat’s transition to a new methodology for statistical accounting of migrants, author considers the period from 2012 to 2017 in order to avoid incomparability.
The descriptive statistics of dependent variables are presented in Table
Three regression models were evaluated by a combined sample via the method of least squares (MLS, pooled regression), which does not take into account the individual effects of municipalities, since we assume that in the municipalities of the YaNAO, the influence of missed or unobserved variables that characterize their individual characteristics is random. A logarithmic model specification is used for simpler interpretation of coefficients. The results are presented in Table
The results of the first regression have shown significance of demographic parameters for reproductive behaviour. Thus, an increase in divorce rate by 1% reduces age-specific fertility rate by 0.35%. At the same time, the estimate of the coefficient for the marriage rate is statistically significant only at the 10% level, which can be explained by the decline in the value of the institution of registered marriage and greater tolerance for unregistered partnerships.
| Average | Minimum | Maximum | |
| Age-specific fertility rate (‰) | 63.17 | 43.19 (city of Gubkinskiy, 2016) |
102.29 (Priuralsky municipality, 2014) |
| Inbound migration rate (‰) | 66.69 | 27.61 (Shuryshkarsky municipality, 2016) |
143.81 (city of Gubkinskiy, 2011) |
| Outbound migration rate (‰) | 76.81 | 41.58 (Priuralsky municipality, 2014) |
153.13 (city of Novy Urengoy, 2012) |
. Regressions estimates (robust standard errors are given under coefficients in parentheses)
| Variables | Dependent variable | |||||
| l_SpFR Age-specific fertility rate | l_ ImmigrationRate Inbound migration rate | l_ EmigrationRate Outbound migration rate | ||||
| Const | 12.53 (2.41) | *** | -12.78 (3.81) | *** | 0.47 (4.37) | |
| l_Education | -0.30 (0.13) | ** | - | - | - | - |
| l_VvedenoZhilya | 0.04 (0.03) | - | - | - | - | |
| l_SquarePP | - | - | 0.30 (0.31) | 0.24 (0.25) | ||
| l_FamReceived | -0.08 (0.03) | * | - | - | - | - |
| l_MarriageRate | 0.31 (0.15) | * | - | - | 0.94 (0.32) | ** |
| l_DivorceRate | -0.35 (0.11) | *** | - | - | -0.52 (0.33) | |
| l_Wage | -0.61 (0.19) | *** | 1.66 (0.39) | *** | 0.21 (0.42) | |
| l_EmploymentRate | 0.14 (0.05) |
** | -0.42 (0.21) | * | -0.15 (0.14) | |
| WorkersExtraction | - | - | 0.78 (0.54) | 1.60 (0.64) | ** | |
| WorkersBuilding | - | - | 0.89 (0.74) | 0.13 (0.51) | ||
| WorkersTransport | - | - | -0.98 (1.08) | 0.83 (0.93) | ||
| time effects | Yes | Yes | Yes | |||
| R2 | R-squared | 0.749 | R-squared | 0.566 | R-squared | 0.638 |
| Adjusted R-squared |
0.698 | Adjusted R-squared |
0.494 | Adjusted R-squared |
0.565 | |
| Number of observations | 78 | 78 | 78 | |||
The first model reveals statistically significant relationship between average monthly wages in municipality and fertility. At the same time, the negative coefficient indicates that the decline in fertility is associated with higher incomes of the population. In particular, the value of a high income for a woman may be greater than having a child, as the price of her time increases.
Among the significant explanatory variables are those that describe the situation in the housing market: with a 1% increase in the share of families who received housing among those registered in the program, age-specific fertility rate potentially decreases by 0.08%. A similar effect was also found in (Korel I. and Korel L. 1999). The authors suggested that the occurrence of such an effect is due to the fact that for each municipality its own standards for registering families are possible, which forms queues of different lengths. Among the criteria required for registration, there may be different indicators of housing provision. In this case, with relatively small amounts of housing input per capita in the municipality, which is typical for the northern regions, the queue for those in need of housing and improvement of housing conditions will move more slowly. According to this logic, the less favourable the situation in the housing market in the municipal entity, the more time the population will be queuing for housing, hence the inverse correlation between the proportion of families who received housing among the needy and fertility. Also, this result can be explained in general by the small proportion of families who have received housing among those in need (this indicator on average fluctuated at 10% in different municipalities). In general, the negative ratio obtained may also indicate that there are other criteria for granting housing to the needy, other than those related to the presence of children.
The variable characterizing an amount of housing put in use, based on the obtained estimates, does not affect age-specific birth rate, which contradicts the hypothesis of the study. In some intermediate versions of the model, author tested variable average housing area per one inhabitant, which also turned out to be statistically insignificant. This result gives grounds to assume that the housing policy in the period under study was fairly unsuccessful and did not affect the decision to have children.
Share of the employed was found to be positively associated with the birth rate. Unfortunately, based on the proposed model specification, it is impossible to estimate whether an increase in the share of employed women or men may have a positive effect on fertility.
The link between the indicator of preschool enrolment and fertility is quite controversial. With a 1% increase in preschool services enrolment, age-specific fertility rate decreases by 0.3%. Similar results are found in other studies: in the work (
The second model revealed statistical relationship between the dependent variable and the average monthly wages. This supports the thesis that it is the high level of wages in the region that is the most attractive factor for migrants. Another significant variable is the proportion of employed in the total working-age population. Due to the fact that the YaNAO has relatively low unemployment rates compared to the average for Russia, municipalities with lower employment rates may be more attractive to migrants (this assumption is based on the analysis of migration modelling). The per capita housing variable is not statistically related to the number of arrivals, which contradicts the hypothesis of the study. Some intermediate versions of the model also included the variable characterizing the number of residential houses put in use, and it also turned out to be statistically insignificant. It can be assumed that the incoming population prefers to buy housing outside the region, probably, in their historical homeland. According to the regression results, the structure of municipal economy also is not statistically related to the number of arrivals.
In the third model we find marriage rates among the statistically significant variables. This may suggest that with high rates of marriage in municipalities, a person’s chances of marriage are diminishing, which may prompt them to move. On the other hand, a reverse dependence here is quite likely, when the marriage itself can induce the spouses to change their place of residence. It is worth noting that one of the limitations of these indicators is the peculiarities of collecting statistics for their calculation: statistics on marriages are collected at the place of registration of the marriage itself, and not at the place of residence of the spouses, therefore in some cases there may be discrepancies in this aspect.
Another significant variable was the one that reflected the share of those employed in mining: the highest number of departures is typical of municipalities with a high proportion of those employed in this industry. One of the possible explanations may be high and specific qualification requirements for workers in the industry, in connection with which the local population, which does not have the necessary skills, is forced to migrate to look for work even in the conditions of formal availability of open vacancies in the place of residence. The increase in wages may also indicate an increase in labor requirements, which the local population often does not meet, but this variable was not significant. Also, among the statistically insignificant variables were the average area of per capita residential housing and the share of those employed in construction, transport and communications. The insignificance of the variable reflecting the situation in the housing market can be explained by the fact that in this region this issue is not so acute due to the low density of the living population and its very high mobility.
Conclusion
The study revealed the presence of a statistical relationship between age-specific fertility rate and such indicators as the marriage and divorce rates, the level of wages, the share of employed in the working-age population, the coverage of children with preschool education, as well as the share of families who received housing or improved housing conditions among those registered within housing program. The inbound migration rate turned out to be statistically related to the level of wages and the share of employed in the total working-age population, and the outbound migration rate — to the share of those employed in the mining sector, as well as indicators characterizing the situation in the marriage market. These results must be taken into account when adjusting the existing and developing new measures of regional demographic policy.
Among the limitations of this study, the following points can be noted:
- some variables can gain both underestimated and overestimated coefficients due to their shortcomings associated with the peculiarities of collection and availability of municipal statistics;
- working with the data of municipal statistics without reference to specific individuals, the author is deprived of the opportunity to investigate the directions of causal relationships, and therefore there is a variability in the interpretation of the obtained results;
- the estimates of the coefficients obtained in the work may be biased due to the small number of observations, and therefore their values must be interpreted with caution;
- official statistics do not keep records of migrants working in shifts; in this regard, the estimates obtained can also distort the real situation in relation to the entire contingent of migrants.
Despite this, the results of the study are of practical and scientific interest. The research hypotheses that have not been confirmed, although intuitively clear, deserve attention. Thus, in all three models considered in the study, the indicators characterizing the housing market turned out to be statistically insignificant. This result may indicate limited effectiveness of the housing policy in the period under review. It can also be interpreted as the lack of interest of the local population in the regional housing policy when buying housing, its insignificance when deciding whether to come or leave, since people prefer to buy housing outside the region. These questions should be the subject of more detailed research.
Reference list
- Aleshkovsky IA (2007) Determinanty vnutrennei migratsii naseleniya v Rossii. Avtoreferat kand. ehk. nauk [Determinants of internal migration of the population in Russia. Summary of the PhD Thesis]. M., 2007.
- Andrienko Yu, Guriev S (2006) Razrabotka prikladnoi modeli vnutrennikh i vneshnikh migratsionnykh potokov naseleniya dlya regionov Rossiiskoi Federatsii [Development of an applied model of internal and external migration flows of the population for the regions of the Russian Federation]. Report on the project within the framework of the Program for support of independent economic analytical centers of MPSF. CEFR, 2006.
- Andersson G, Duvander AZ, Hank K (2004) Do childcare characteristics influence continued childbearing in Sweden? An investigation of the quantity, quality and price dimension. Journal of European Social Policy 14(4): 407–418.
- Andrienko Y, Guriev S (2004) Determinants of interregional mobility in Russia. Evidence from panel data. Economics of Transition 12(1): 1–27.
- Arkhangelsky VN (2006) Faktory rozhdaemosti [Fertility factors]. M.: TEIS.
- Becker G (1960) Demographic and Economic Change in Developed Countries. Princeton, N.J.: Princeton University Press.
- Becker G, Lewis HG (1973) On the Interaction between the Quality and the Quantity of Children. The Journal of Political Economy 81(2): 279–88.
- Behrman JR, Rosenzweig MR (2002) Does Increasing Women’s Schooling Raise the Schooling of the Next Generation? American Economic Review 92(1): 323–334.
- Bumpass L, Sweet J, Cherlin A (1991) The Role of Cohabitation in Declining Rates of Marriage. Demography (53): 913–27.
- Chen A, Coulson NE (2002) Determinants of urban migration: Evidence from Chinese cities. Urban Studies 39(12): 2189–97.
- Database of indicators of municipalities. URL: https://www.gks.ru/scripts/db_inet2/passport/munr.aspx?base=munst71
- Easterlin R (1970) Towards a socioeconomic theory of fertility: survey of recent research on economic factors in American fertility. In: Fertility and Family Planning: A World View. AnnArbor: University of Michigan Press.
- Gerber T (2000) Regional migration dynamics in Russia since the collapse of communism. University of Arizona, Mimeo.
- Gerber T (2006) Regional economic performance and net migration rates in Russia, 1993–2002. International Migration Review 40(3: 661–97.
- Ghatak S, Mulhern A, Watson J (2008) Inter-regional migration in transition economies: The case of Poland. Review of Development Economics 12(1): 209–22.
- Corijn M (2001) Transition to adulthood: Sociodemographic factors. In: Transitions to Adulthood in Europe. Springer, Dordrecht. Pp. 1–25.
- Heaton TB, Jacobson CK, Holland K (1999) Persistence and Change in Decisions to Remain Childless. Journal of Marriage and the Family 61(2): 531–39.
- Jeon Y, Shields M (2005) The Easterlin Hypothesis in the Recent Experience of Higher-Income OECD Countries: A Panel-Data Approach. Journal of Population Economics 18(1): 1–13.
- Kögel Т (2004) Did the association between fertility and female employment within OECD countries really change its sign? Journal of Population Economics 17(1): 45–65.
- Korel I, Korel L (1999) Migratsionnye i makroehkonomicheskie protsessy v postsotsialisticheskoi Rossii: regional’nyi aspekt [Migration and Macroeconomic Processes in Post-Socialist Russia: Regional Aspect]. M.: RPEI/Eurasia Fund. (in Russian)
- Kravdal O, Rindfuss RR (2008) Changing Relationships between Education and Fertility: A Study of Women and Men Born 1940 to 1964. American Sociological Review (73): 854–73.
- Lee ES (1966) A Theory of Migration. Demography 3(1): 47–57.
- Maleva TM, Sinyavskaya OV (2006) Sotsial’no-ehkonomicheskie faktory rozhdaemosti v Rossii: ehmpiricheskie izmereniya i vyzovy sotsial’noi politike [Socio-economic factors of fertility in Russia: empirical dimensions and challenges to social policy]. SPERO (5): 70–97. (in Russian)
- Miller AR (2010) The Effect of Motherhood Timing on Career Path. Journal of Population Economics 24(3): 1071–100.
- Mills M (2004) Stability and Change: The Structuration of Partnership Histories in Canada, the Netherlands and the Russian Federation. European Journal of Population 20: 141–75.
- Mironova YuG, Tyrnova NA (2014) Sozhitel’stvo kak al’ternativnaya forma semeino-brachnykh otnoshenii v sovremennom rossiiskom obshchestve [Cohabitation as an alternative form of family and marriage relations in modern Russian society]. Vestnik VolGU [Volzhsky University Bulletin], Series 7: Philosophy. Sociology and social technologies (3): 54–60. (in Russian)
- Mulhern A, Watson J (2009) Spanish internal migration: Is there anything new to say? Spatial Economic Analysis 4(1): 103–20.
- Napolitano O, Bonasia M (2010) Determinants of different internal migration trends: The Italian experience. MPRA Paper № 21734. URL: https://mpra.ub.uni-muenchen.de/21734/1/MPRA_paper_21734.pdf
- Popova LA (2007) Vnebrachnaya rozhdaemost’: tendentsii, prichiny, modeli razvitiya vnebrachnoi sem’i [Out-of-marriage fertility: trends, causes, development models of an non-registered family]. Syktyvkar: Scientific Center of Komi republic. (in Russian)
- Rosen M (2004) Fertility and Public Policies-evidence from Norway and Finland. Demographic Research 10(6): 143–70.
- Roshina YaM, Boykov AV (2005) Faktory fertil’nosti v sovremennoi Rossii [Fertility factors in modern Russia]. M.: EERC. (in Russian)
- Sarra AL, Signore M (2010) A Dynamic Origin-constrained Spatial Interaction Model Applied to Poland’s Inter-provincial Migration. Spatial Economic Analysis 5(1): 29–41.
- Sinyavskaya OV, Tyndik AO, Golovlyanitsina EB (2009) V kakikh sem’yakh rozhdayutsya deti? Faktory reproduktivnogo povedeniya v Rossii [In which families are children born? Factors of reproductive behavior in Russia]. In: Sinyavskaya OV (Ed) Sem’ya v tsentre sotsial’no-demograficheskoi politiki? Sbornik analiticheskii statei [Family at the center of social and demographic policy? Collection of analytical articles]. M.: IISP. Pp. 19–46. (in Russian)
- Sobotka T (2004) Postponement of Childbearing and Low Fertility in Europe. Amsterdam: Dutch University Press.
- Tikhomirov DA (2009) Dobrachnye sozhitel’stva v Moskve kak novaya sostavlyayushchaya matrimonial’nogo povedeniya molodezhi [Premarital cohabitation in Moscow as a new component of youth matrimonial behavior]. Znanie. Ponimanie. Umenie [Knowledge. Understanding. Skill] (3): 106–10. (in Russian)
- Toulemon L, Testa MR (2005) Fertility Intentions and Actual Fertility: A Complex Relationship. Population & Societies 415(4): 1–4.
- Vakulenko ES (2013) Modelirovanie migratsionnykh potokov na urovne regionov, gorodov i munitsipal’nykh obrazovanii. Dis. na soiskanie stepeni kand. ehkon. nauk [Modeling migration flows at the level of regions, cities and municipalities. PhD Thesis]. M.: NRU HSE. (in Russian)
- Vakulenko ES, Mkrtchyan NV, Furmanov KK (2011) Modelirovanie registriruemykh migratsionnykh potokov mezhdu regionami Rossiiskoi Federatsii [Modeling of registered migration flows between regions of the Russian Federation]. Prikladnaya ehkonometrika [Applied econometrics] 1(21): 35–54. (in Russian)
- Zakharov SV (2010) Budushchee rossiiskoi rozhdaemosti. Doklad na nauchnom seminare IDEM GU-VSHEH «Demograficheskie vyzovy XXI veka» [The future of Russian fertility. Report at the scientific seminar IDEM HSE «Demographic challenges of the XXI century»]. Demoscope-Weekly: 413-414. URL: http://demoscope.ru/weekly/2010/0413/nauka02.php (in Russian)
- Zhuravleva TL, Gavrilova YaA (2017) Analiz faktorov rozhdaemosti v Rossii: chto govoryat dannye RMEHZ NIU VSHEH? [Analysis of fertility factors in Russia: what do the HSE RLMS data say?]. Ehkonomicheskii zhurnal VSHEH [Economic journal HSE] 1(21): 145–87. (in Russian)
- Zyryanova MA (2018) Otsenka sotsial’no-ehkonomicheskikh faktorov, soputstvuyushchikh dinamike rozhdaemosti, v severnykh regionakh Sibiri [Assessment of socio-economic factors accompanying the birth rate dynamics in the northern regions of Siberia]. Rossiya: tendentsii i perspektivy razvitiya [Russia: trends and development prospects] (13-2): 667–71. (in Russian)
Information about the author
Barkova Ekaterina Romanovna, Leading Specialist, State Budgetary Institution «Multifunctional Center of Moscow», Moscow, 125009, Russia. E-mail: kulakovakateriina@gmail.com