|
Corresponding author: Alexandra A. Moskaleva ( saschamosk@gmail.com ) © 2020 Alexandra A. Moskaleva.
This is an open access article distributed under the terms of the Creative Commons Attribution License (CC BY 4.0), which permits unrestricted use, distribution, and reproduction in any medium, provided the original author and source are credited.
Citation:
Moskaleva AA (2020) Socio-economic determinants of fertility using assisted reproductive technologies in the Russian Federation regions. Population and Economics 4(4): 19-42. https://doi.org/10.3897/popecon.4.e59062
|
Abstract
Assisted reproductive technologies (ART) are an infertility treatment tool. In Russia, more than 250 centers implementing infertility treatment with the help of ART have been opened in 67 regions. In 2014, in vitro fertilization (IVF) was included in the programme of state guarantees, and since 2016 the service can be obtained within the Mandatory Health Insurance (MHI) system. Author of this study analyzes how the impact of economic factors on fertility with the use of ART has changed in relation to the inclusion of IVF in the MHI system, and what social factors affect the usage of this technology. The analysis bases on the panel data for the regions of Russia covering the period from 2011 to 2017. The fixed effects method was used to assess the impact of various factors. The study shows that the population income level has a significant positive impact on the proportion of births with the use of ART even after the inclusion of IVF into the MHI programme. At the same time, the inclusion of IVF in the MHI programme has led to an increase in the proportion of births using ART. The positive effect of this inclusion is higher in wealthier regions. Among social factors, a significant impact has the accessibility of information about the procedure, which is measured by the share of population having access to the Internet.
Keywords
infertility treatment markets; assisted reproductive technologies; in vitro fertilization; mandatory health insurance; socio-economic determinants; regions of the Russian Federation
Introduction
Two key concepts used in this paper are infertility and assisted reproductive technologies (ART). In this study, infertility is considered from the perspective of medical practice according to WHO’s definition as a disease of the male or female reproductive system defined by the failure to achieve a pregnancy after 12 months or more of regular unprotected sexual intercourse. There are two types of infertility: primary, when a woman cannot become pregnant with her first child, and secondary, when a woman already has children, or she was pregnant but cannot become pregnant again. ART is a group of medical technologies, treatments and procedures aimed at achieving pregnancy, in which part of the manipulations is carried out outside the body, in vitro.
According to survey estimates, the level of primary infertility in the Russian Federation in 1990 was 2.2%, in 2010 – 2.9%, and level of secondary infertility – 18.2 and 19.2% respectively (
The importance of IVF as a tool of public policy in the field of demography is marked by the inclusion of the procedure in the passport of the national project Demography in the form of a target: to perform no less than 70,000 IVF cycles per year with an increase of 2,000 cycles in each subsequent year, starting in 2019. To increase accessibility of the IVF procedures, in 2013-2014 they were included in the programme of state guarantees, at first with payment at the expense of the federal budget and budgets of the constituent entities of the Russian Federation. Since 2016, the procedure for providing IVF in the programme of state guarantees has been changed: it is included in the mandatory health insurance programme (MHI) and is financed by the MHI Fund (FMHI).
The inclusion of IVF in the government guarantees programme should increase the availability of the technology to all groups of the population and change the set of factors affecting the use of the procedure, reducing the role of economic ones. Increased access to ART may help to make up for the decline in fertility associated with high infertility rates among married couples. Estimation of the effects of the IVF inclusion in the programme of state guarantees is the purpose of this study.
Literature review
Publications on the topic of this research are scarce both in domestic and foreign literature. ART studies are divided into: studies of factors of ART usage (
ART usage factors
The first group of factors for the use of ART are factors that influence predisposition to infertility. Based survey data analysis some studies reveal that obesity, low education, higher age of the woman and higher age at marriage are associated with higher risks of infertility (
The second group of factors for the use of ART is technology awareness factors: the impact of information on the effectiveness of the procedure is discussed in the reports of ART clinics in the United States (
The third group of factors for the use of ART are accessibility factors, or socio-economic factors: the level of development of the health care system, the work of public funds (
The fourth group of factors in the use of ART is cultural factors: religious composition of population, traditions in the division of gender roles, level of gender discrimination in the society (Bennett 2016).
State regulation of the use of ART
Several publications highlight the impact of reproductive technology policy, its effectiveness and benefits to the State. Many existing studies are based on the US data, as measures to regulate the application of the technology differ across the states and were introduced at different times. In the US, health insurance mandates – legislatively enshrined requirements for the employer or individual to acquire health insurance – are arranged differently. This creates an opportunity to use the difference-in-difference method and compare the effectiveness of various regulations. In the work of Marianne P. Bitler and Lucie Schmidt (Bitler, Schmidt 2012), the comparative effectiveness of different formats of health insurance for IVF use is evaluated on the basis of survey data. Basing on the logit model, the authors find that the introduction of insurance mandates did not affect inequalities in access by race and socioeconomic status.
An important question in research on the US is whether the state policy affects treatment programme choices. The choice is compared between a more “aggressive” but more effective treatment option, where more than two embryos are transplanted during an IVF procedure, and a safer one when only one embryo is transplanted. The impact of the health insurance options is analyzed using the least squares method (OLS) with two-way fixed effects at clinic and market levels (Hamilton, McManus 2011). Insurance mandates increase the availability of the technology and can reduce the number of multiple births, but their effectiveness varies widely depending on the type of insurance. In the study by Kasey S. Buckles (
Impact of the use of ART on demographics
A number of studies consider ART as a factor influencing fertility rates: number of births, eventual cohort fertility, total fertility rate.
Based on the simulation model of population reproduction, built using the Monte Carlo method on historical data for France, Henri Leridon (
Studies show the presence of a significant positive relationship between the number of ART procedures and the total fertility rate (TFR) in Europe (Burcin et al. 2014). Another result was achieved when analyzing the impact of the growth of government support for infertility treatment on TFR and the age of the mother at birth of the first child in the United States (Machado et al. 2015). The probit model shows that insurance mandates for infertility treatment in the 1980-1990s did not affect the total birth rate of cohorts, rather, they led to a shift in the births calendar and postponement of motherhood.
ART usage factors
Basing on the literature review results, the author of this study systemized factors affecting the use of ART and composed a list of relevant control variables. Figure

Three-level scheme of influence of factors on the decision on the use of ART. Source: compiled by the author on the basis of the literature review.
At the first level, the patient’s medical diagnosis is determined: under the influence of environmental factors and previous reproductive behaviour, the reproductive health status is defined, and it determines the occurrence of the infertility diagnosis.
The awareness of the need for using ART occurs at the second level – the level of social need formation. Here, the decision is influenced by the woman’s age (with age the need to use ART increases if the woman does not have children), the marital status of the woman (the decision of the woman can be influenced by the partner’s opinion and the need to realize oneself as a mother). Through attitude to the technology the formation of social need is influenced by education (how much a woman trusts the technology) and religion (the acceptability of medical intervention in the process of conception).
The third level is the accessibility level. Factors of the third level have an impact on the ability to take advantage of the technology if a woman has already decided that she would like to use ART. These factors can be influenced by state policy measures, which include: level of development of the mother and child health care system which show how safe and effective the procedure can be for a woman; economic factors including level of income and income inequalities showing the financial availability of the technology; social factors including information and territorial accessibility of ART services.
We are particularly interested in the impact of economic and social factors on the use of ART in the regions of Russia and the combination of the influence of these factors with the influence of fertility policies increasing the availability of ART.
ART in Russia
Assessing infertility levels is a difficult task. Apart from differences in the definition of the concept itself, there is a problem with data quality. Estimates gathered from the population surveys are underestimated because the topic of infertility is difficult for respondents (Thonneau, Spira 1990;
Since 1995 the Russian Association for Human Reproduction (RAHR) has issued reports on the use and development of ART in Russia. The RAHR register contains data on the dynamics of the number of ART procedures in the country and the dynamics of the number of children born alive using ART. Since 1995, the number of children born using ART has been growing rapidly, reaching almost 35,000 children per year in 2017. Figure

Number of children born using ART (left axis) and the rate of increase in the number of children in % (right axis). Source: compiled by the author according to the RAHR register.
Note that after 2013 there was a small spike in the number of births using ART and the growth rate has been accelerating. Similar spikes were observed in 1997 and 2002, but then growth accelerated with relatively few births (< 5,000 thousand children).
Figure

Distribution of ART clinics in Russia, March-April 2020. Source: compiled by the author on the basis of data on clinics on the Internet.
Analysis of the structure of ART cycles according to the register shows that the age of patients of IVF clinics is increasing, while the proportion of multiple births decreases, although studies have linked the factor of multiple births with age as well (Egorova, Pyankova 2010). The standard protocol for IVF is replaced by its modifications, which is important to take into account when determining the list of services available to citizens within MHI programme.
Inclusion of IVF in MHI
State support for IVF in Russia began with the inclusion of this procedure into the programme of state guarantees with funding from the federal budget and regional budgets in 2013. In fact, this change took its effect in 2014, which is reflected by the frequent mention of this year in news reports. The inclusion of IVF in the programme of state guarantees is due to the fact that, firstly, since 2014 the MHI programme has begun to include the most commonly used methods of high-tech assistance to enhance their accessibility, and secondly, the national project Demography identified the number of IVF procedures for the future. Analysis of the information published at the websites of specialized clinics and departments showed that the IVF programme funded by MHI has not been launched at the same time in all Russian regions: in some places it started in 2013, while in others – in 2014. This might be an additional aspect worth of studying while estimating the impact of IVF inclusion in MHI, but it requires a detailed analysis of territorial programs of state guarantees in all regions.
Since 2016 IVF is included in the basic MHI programme with funding from the FMHI, i.e. the procedure can be arranged by prescription of the gynecologist and covered by the MHI policy. There are no restrictions on the number of IVF attempts via MHI, the only exception is due to the frequency of attempts within one year: no more than two attempts per year are allowed, which is due to medical reasons.
This study examined the change in IVF availability after incorporating it into the state guarantee Programme in 2014. It is not currently possible to analyze the change in the availability of IVF after its inclusion in the basic MHI programme in 2016, since as of carrying out this study, data from the ART register are only available for 2017, i.e. one year after the inclusion of IVF into MHI. The author of the study decided to consider 2014 the year of incorporation of IVF into the MHI due to the fact that in 2013-2014, along with other adjustments in MHI due to the expansion of the high-tech medical care, the programme itself underwent changes, so in 2013 it could not yet be seen as fully operational.
Methods and results
This study uses panel data gathered by regions or clinics, and individual medical history data. Depending on the available data, in different cases the author exploits three analytical approaches, i.e. difference-in-differences method, a panel model with fixed effects, and a binary choice model. In Russia, the necessary individual data are not available to researchers for several reasons. Firstly, personal medical information is highly confidential. Secondly, in Russian longitudinal surveys, such as the Russian Longitudinal Monitoring Survey HSE (RLMS-HSE) and Parents and children, men and women in the family and society (Russian GGS), questions about infertility and the use of ART are either not raised or very few respondents note the use of such technologies. Finally, there was no natural experiment in the process of incorporating IVF into the MHI programme, as the inclusion of state guarantees in the programme took place at the federal level. Therefore, the author uses panel data for analysis.
The study combines data from the RAHR register, Federal Research Institute for Health Organization and Informatics of Ministry of Health of the Russian Federation, and the Federal State Statistic Service (Rosstat). Data on the regional distribution of the number of births using ART are not available in open sources, so the author builds an indicator based on data on multiple births in the regions. The analysis covers panel data for 85 regions of Russia (up to 2015 – 83 regions) for 2010-2017. The period for data collection is limited from above by the availability of ART RAHR register data. 2011 was used as the lower boundary for two reasons. Firstly, in 2011 the development of ART reached a new level: 398 children out of 1 million were born with the help of ART according to RAHR. Secondly, with the choice of 2011 as the lower limit, we end up with an interval covering 3 years before and 3 years after the inclusion of IVF in the State guarantee programme. Data from 2010 is needed to build models with an explanatory variable lag of one year. This lag order is applied because pregnancy lasts about 9 months, and a similar lag might be found in the literature (Hamilton, McManus 2012). The described analytical sample consists of 585 observations.
The control variables are divided into four following groups: 1) infertility incidence; 2) demographics; 3) health care system characteristics; 4) characteristics of the ART market in the country.
The first group of variables includes the rate of infertility for a specific year per 10 million population of the corresponding sex in reproductive age. Demographics include the overall marriage rate, the proportion of women in late reproductive ages, i.e. 35 to 49 years old (Hamilton, McManus 2012), as a measure of the proportion of the population potentially having a need for the use of ART. However, as it was mentioned above, there is a problem with the reliability of data on infertility prevalence, so within this study we will use environment pollution levels together with air pollution, wastewater and the industrial and environmental index as proxies for infertility prevalence in some models. These indicators reflect an expert assessment of the negative impact of industrial development on the environmental situation in the region. Male infertility is excluded from the list of control variables, because there is a lot of missing information in these data and they are available only since 2011.
To characterize the health care system the author uses two classic indicators of the system’s resource provision: number of gynecological beds (i.e. places in specialized hospitals) and number of gynecologists per 10,000 female population. Note that the indicator of provision of gynecologists includes the provision of medical reproductologists who, according to the nomenclature of medical specialties, are part of the group of obstetricians and gynecologists. The indicator of women’s attitude to their health is the proportion of women registered with a doctor at the early stages of pregnancy. Also, as an alternative variable for the development of the health care system, the Index of the mother and child health care system development (HSE), is included in the analysis.
The characteristics of the ART market are constructed on the basis of the collected array of data on clinics and contain indicators of the share of government and specialized clinics in a given year.
The links between groups of factors, their meaning and corresponding variables are given in Table
| Group | What is characterized | Variable (source) | In literature |
| Reproductive health | Prevalence of infertility | Male infertility, female infertility (Ministry of Health) | - |
| Demographics | Need for the use of ART | Proportion of women over 35 in the total number of women of reproductive age (calculation) | (Bitler, Schmidt 2012; Hamilton, McManus 2012; |
| Total marriage rate (Rosstat) | ( |
||
| Health Care System Characteristics | Development of the service delivery system | Provision of gynecologists (Ministry of Health) | ( |
| Provision of gynecological beds (Ministry of Health) | |||
| Attitude to health | Proportion of women registered before the 12th week of pregnancy (Ministry of Health) | ||
| Quality of functioning | Index of development of the mother and child health care system (HSE) | ||
| ART market characteristics | Available treatment options | Share of state clinics, share of specialized clinics (calculation) | - |
In addition to these factors, the analysis includes a variable characterizing economic recession to take into account the impact of the 2014-2015 economic crisis. The crisis affects the decision on the birth of a child itself, to say nothing of the decision that requires additional costs, such as in the IVF procedure. The cycle phase indicator is calculated on the basis of GRP growth: at a value of less than zero the variable equals 1, and at a value over zero the variable equals 0.
The variables of interest are divided into three groups: the indicator of inclusion of IVF into MHI, economic and social factors. The relationship between groups of factors, their meaning and corresponding variables are given in Table
The inclusion of IVF in the state insurance programme is modelled by creating a fictitious variable equal to 1 after IVF is included in the MHI. Also, in the analysis, the author uses the covariates of the factor of inclusion of IVF in MHI and economic factors: income level and inequality level.
| Group | What is characterized | Variable (source) | In literature |
| State policy | Policy impact | Dummy variable equal to 1 for 2014−2017 | - |
| Covariates of a fictitious variable with economic factors | - | ||
| Economic | Access to paid services | Real average per capita income (calculation) | ( |
| Inequality in access | Gini Index, measuring inequality of income (Rosstat) | (Hamilton, McManus 2012) | |
| Social | Awareness | Internet access (Rosstat) | ( |
| Access to services | Degree of urbanization (Rosstat)/ Percentage of population in cities with ART centers (calculation) | (Hamilton, McManus 2012) | |
| Attitude to use of the technology | Share of employed with higher education in the total number of employed, % (Rosstat) | (Bitler, Schmidt 2012; Hamilton, McManus 2012; |
Economic factors include the level of real income of the population (income in the prices of the base year, 2010, given the consumer price index), and income inequality based on the Gini Index. The group of social factors includes public awareness measured through the indicator of access to the Internet, territorial accessibility measured through the degree of urbanization, or, more precisely, through the proportion of the population in the cities where ART service delivery centers are located. The study also considers indicators that influence the attitude towards the use of ART: the level of people with higher education in the occupied population as a characteristic of the level of education.
The analysis does not include the characteristics of the religious composition of the population, as when using models with fixed effects based on panel data, it is not possible to identify the influence of variables that do not vary greatly in time. The influence of religion will be factored into the fixed effects of the regions.
Constructing a Dependent Variable
The IVF procedure is arranged so that more than one embryo is often transplanted to the patient to increase the likelihood of pregnancy. Therefore, the author supposes that the distribution of the use of the technology in regions strongly correlates with the distribution of multiple births, which we know from the Federal State Statistics Service data.
Before verifying this assumption, let’s look at the dynamics of multiple births in Russia (Figure
The relevance of this assumption might also be verified based on the US data, which are more complete. The aggregated data on the number of live births using ART and the number of multiple births across the US is plotted in Figure

Dynamics of the multiple births proportion in the total number of births in Russia in 1985-2018, %. Source: compiled by the author on the basis of data of the Federal State Statistics Service.

Correlation between the number of children born using ART and the number of multiple births in the United States for 2015-2017. Source: Compiled by the author according to National Vital Statistics Reports, Centers of disease control and preventions.
Having confirmed our assumption, we can construct a dependent variable – the proportion of children born using ART in the total number of live births in the region as follows:
total_IVF_childreni = pct_mult_birthi . total_IVF_children, (1)
where total_IVF_childreni is the number of children born with the use of ART in the ith region; pct_mult_birthi is the proportion of multiple births in the ith region in total multiple births; total_IVF_children is the total number of children born using ART in Russia.
Basic model specification
The following regression equation is proposed to evaluate models:
Pct_IVF_childrenit = Inst –1 + Inst–1 . Eit–1 + Eit–1 + Sit–1 + Kit–1 + εit , (2)
where t is the period of time; i is the region; Pct_IVF_childrenit is the proportion of children born using ART; Inst–1 is a dummy variable of inclusion of IVF in the MHI programme; Eit–1 is the matrix of economic factors; Sit–1 is the matrix of social factors; Kit–1 is the matrix of control variables; εit is random errors
Three methods for evaluating models based on panel data were used for the analysis: a model with fixed effects of time and the region, a model with random effects, and pooled regression. We estimate four following model specifications: model 1 – pooled regression; model 2 – fixed effects of time; model 3 – fixed effects of the region; model 4 – random effects model.
According to the criterion of adjusted R-square(R2adj), the best model among all fixed effects models is the model with the inclusion of fixed effects of the region: 0.8 versus 0.34. A model with simultaneous incorporation of effects for time and region was not constructed because of insufficient data to account for such a number of dummy variables. The results of the test for linear constraints, Breusсh–Pagan and Hausman tests, indicate the choice of the fixed effects model. This model is used for further analysis.
Baseline specification: results
Table
Panel model evaluation results, dependent variable: proportion of children born with ART in total number of live births
| Pooled regression | Fixed Effects of time | Fixed Effects of the region | Random effects | |
| (1) | (2) | (3) | (4) | |
| Inclusion in MHI | −2,92*** | −2,05** | −2,33** | |
| (1,12) | (1) | (1,09) | ||
| Inclusion in MHI * income | 0,44*** | 0,39*** | 0,22** | 0,29*** |
| (0,12) | (0,13) | (0,11) | (0,11) | |
| Inclusion in MHI * inequality | −2,49 | −1,74 | 0.38 | −0,53 |
| (1,9) | (2,22) | (2,03) | (1,96) | |
| ln (real average per capita income) | 0,37*** | 0,30*** | 0,66** | 0,55*** |
| (0,11) | (0,11) | (0,29) | (0,13) | |
| Income inequality | −1,44 | −1,04 | −6,97*** | −4,12*** |
| (1,15) | (1,05) | (2,06) | (1,18) | |
| Percentage of population in cities where ART is available | −0,02 | −0,04 | −0,02 | 0.09 |
| (0,14) | (0,14) | (0,15) | (0,12) | |
| Percentage of employment with higher education | 1,16*** | 0.59 | 1,46* | 1,28** |
| (0,45) | (0,42) | (0,79) | (0,52) | |
| Percentage of population with access to the Internet | 0,86*** | 0.28 | 0,70*** | 0,76*** |
| (0,16) | (0,19) | (0,17) | (0,11) | |
| Control variables | + | + | + | + |
| Number of observations | 577 | 577 | 577 | 577 |
| Adjusted (R2adj) | 0.73 | 0.34 | 0.8 | 0.8 |
| F-statistics | 81,3*** | 18,2*** | 131,0*** | 2267*** |
The directions of influence for most variables correspond to the expectations of the author. The level of education has a significant positive impact on the proportion of births using ART: more educated citizens are more positive about the use of high-tech medical care. Also, the positive impact of education may be attributed to the tendency to postpone births to a later age due to the increase in the number of years of study, and as age increases, so does the need for the application of ART. The use of the Internet also has a significant positive impact on the dependent variable: greater awareness of both the service itself and the possibility of obtaining government support increases the use of ART. The level of income has a significant positive effect on the proportion of births: the appearance of a child in the family is in any case a cost, and birth using IVF requires additional costs, even if the procedure is funded within the MHI programme. The resulting signs of explanatory variables are consistent with significant valuations at the market/region level in the papers devoted to the US situation.
The key result of the analysis is an assessment of the impact of IVF inclusion in the HMI programme. Two of the three coefficients illustrating this impact were proved to be significant. Based on the model with fixed effects of the region, which was chosen when comparing the models, we see that when IVF is included in MHI (∆Ins = 1) other things being equal:
∆pct_IVF_childreni = –2,05 + 0,22 . ln(Aver_real_incomei), (3)
where ∆pct_IVF_childreni is the change in the proportion of children born using ART in the region; ln(Aver_real_incomei) is the logarithm of real average per capita income in the region.
Then ∆pct_IVF_childreni > 1 will be true for regions where ln(Aver_real_incomei) >9,32, or in translation into rubles – more than 11,159 rubles.
The findings show that inclusion in the programme had a significant positive effect on the proportion of births using ART only in wealthier regions. In poor regions, there is a negative effect from the programme (in the sample for 2017 there were 14 such regions). With the growing wealth of the region, the positive effect increases. Consequently, the inclusion of IVF in the MHI programme helped increase the use of the technology, but exacerbated inequalities in access to it.
Sustainability test: alternative factors
Here we will consider how the use of alternative variables characterizing the same phenomenon will affect the results of model construction. To verify this relation we estimate six additional models using: 1) data on RAHR clinics instead of data on clinics collected by the author; 2) total incidence rate of infertility instead of the indicator of new diagnoses per year; 3) inclusion of maternal and child health rating as characteristics of the quality of system functioning; 4) and 5) environmental factors instead of infertility indicators, which is due to the influence of types of environmental pollution on male and female factors of infertility identified in medical studies; 6) level of urbanization as a proxy variable for territorial accessibility of services instead of the proportion of the population of cities with ART clinics in the total population of the region. The model with fixed effects of regions has been used as a specification to include alternative factors.
The increase in the indicator of the explanatory strength of the R2adj model is observed only in models with the inclusion of environmental factors: an increase of 0.01. Thus, it can be concluded that environmental variables are a little better at describing the real rate of infertility incidence in regions than official statistics. In other models, alternative factors are insignificant. The following variables of interest remained significant in all specifications: the logarithm of real average per capita income (+), inequality (-), percentage of employment with higher education (+), share of households with access to the Internet (+), in 4 specifications out of 6 the inclusion of IVF in the MHI and its impact associated with the income level is significant. The results of the evaluation of the basic specification are generally stable regarding the use of alternative factors.
Accounting for spatial relationships
An analysis of information provided on the websites of regional ministries and health care departments has shown that there was mobility between nearby regions to obtain ART services: some patients are sent to other regions for treatment. Also, on the sites of some clinics there is an IVF programme according to the transport scheme. When using this programme, part of the treatment takes place in the city where the patient lives, and the IVF procedure is performed directly at a clinic in another city. In addition, there are regions where there are no IVF centers in the sample, but we still calculate the proportion of children born using ART based on the method of forming a dependent variable. It follows that the rate of births using ART also depends on where the region is located geographically and with which regions it borders. Misappropriation of spatial effects can lead to a shift in coefficient estimates.
To take into account these factors, we will use methods of modelling spatial relationships. To do this, we shall carry out the following steps:
- We shall choose a method to form a matrix of spatial weights.
- We shall carry out statistical tests for the presence of spatial dependence in the data.
- If there is a significant relationship, we shall choose a method for estimating spatial panel regression.
A key element in the analysis of spatial relationships is the matrix of spatial weights. Several classes of methods for creating similar matrices are given in the literature.
The basis of the first group of methods is geographic distances between objects. Distances between the centers of spatial objects, calculated as the distance between points on the plane with latitude and longitude coordinates (for objects in one region/district), as the distance between points on a circle (for countries/regions), as the distance by railway (Vakulenko et al. 2012) or by roads (
For this group of methods, several variations in calculating diagonal elements of the spatial weights matrix (W) are used after obtaining the distance matrix between objects. The first option is calculation of the values inverse to distance (dij) : 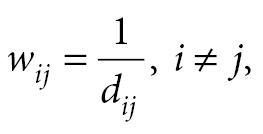 or inverse to the square of the distance:
 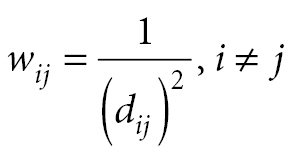 (
(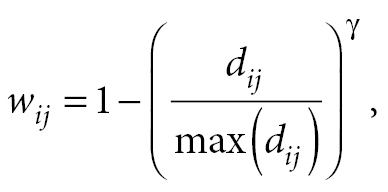 where γ > 0 is the degree of difference between the influence of near and remote objects (
The second group of methods is the creation of an adjacency matrix, for example, a weighted matrix by the number of neighbours. The adjacency matrix is created in different ways based on the use of graph analysis methods. A variant of the matrix, in which the presence of a boundary is denoted as 1 (Kolomac 2010) is common, after which the weighted matrix is calculated.
The third group of methods is to create a proximity matrix in the characteristic space. Distance matrices in physical space and space of characteristics are combined for analysis.
Two sets of distance data have been used to analyze spatial influence. The first array is data on distances between the centers of the regions, the second is data on distances by railway between the centers of the regions (if there are ART clinics in the region, they are certainly available in the regional center) collected by the author. If there is no railway station in the city, we used the distance to the nearest station, to which we added the distance of travel by car. For pairs of regions between which there is no railway connection, we used the distance of flight by plane. Such distance would be less than by railway or by road, and it is assumed that a rational person would rather take a flight for these pairs of regions, that is, if deciding to travel so far at all. Finally, for those regions, between which there is no air communication, a transfer flight is used: a person travels to the nearest city, which has air communication with the region that is difficult to access, then travels there by plane.
To construct a matrix of spatial weights, five options for calculating elements are used:  and
and 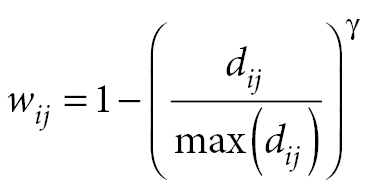 with values γ = {1; 0,5; 0,2; 0,1}. To improve the accuracy of the matrix, the analysis includes an adjustment matrix based on the location of clinics, where wij = 0 if there is no IVF clinic in either of the two regions. To obtain the final matrix of spatial weights, the balance matrix and the adjustment matrix are multiplied elementally. After multiplying, the values along the lines are weighted: the sum of the values by line is equal to 1.
Inverse matrices for distances on railways and between centers in a straight line are very similar. Matrices with large values of the gamma parameter (1 and 0.5) are very sparse, since they do not give more value to closer regions than farther ones. Therefore, in further analysis, these matrices are not used.
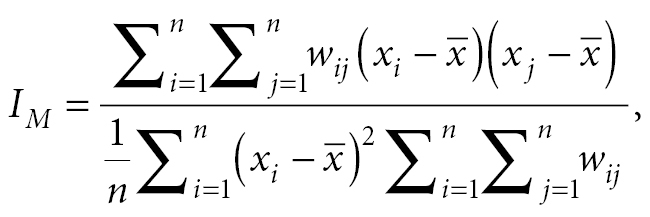
Several tests have been developed to verify spatial dependence (
 (4)
(4)
where wij is the element of the spatial weights matrix located at the intersection of the ith row and the jth column; xi,j is the value of the variable for which the presence of spatial relationships is verified, in our case – the proportion of those born with the use of ART in the region.
Table
In 2013, there is no significant spatial relationship in the values of the proportion of births with the use of ART in the regions of Russia. In other years, a significant positive relationship is observed for all years when using inverse distances and for almost all years when using another metric for evaluating elements of the weight matrix. Moran indexes values for railway-based matrices are greater than the values for the matrix for normal distances between centers. This suggests that matrices based on railway data show a closer spatial relationship in the data. Consequently, they can be considered more accurate for capturing spatial effects. For further analysis, we shall use Matrix 2 with inverse distances across railways, since Moran index estimates for this matrix are positive for all the years under consideration which is consistent with intuition about the nature of spatial relationships.
Moran coefficient values for different types of spatial weights matrices
| Year | Matrix 1 | Matrix 2 | Matrix 3 | Matrix 4 |
| 2017 | 0,019* | 0,030** | 0,002** | 0,006** |
| 2016 | 0,070*** | 0,071*** | 0,014*** | 0,017*** |
| 2015 | 0,044*** | 0,051*** | −0,004 | −0,002* |
| 2014 | 0,028** | 0,037*** | −0,002* | 0,005* |
| 2013 | 0.005 | 0.013 | −0,007 | −0,006 |
| 2012 | 0,023** | 0,036** | 0,007*** | 0,009*** |
| 2011 | 0.008 | 0,015* | −0,003 | −0,006* |
Models on panel data with spatial effects are evaluated either using the maximum likelihood method or generalized moment method (can only be used to estimate models with spatial interaction in errors). We will apply the maximum likelihood method: it is more versatile with respect to spatial evaluations of models because it can be used to evaluate all types of models.
Spatial effects can be taken into account in three ways: including explanatory variables in the spatial lag model, spatial lag of the dependent variable, and calculation of spatial errors. According to these options, there are four main types of spatial models with fixed effects (
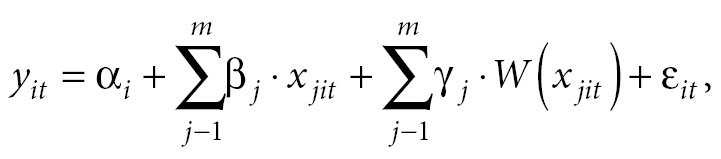
- Spatial cross model with fixed effects (Spatial cross- regressive (SLX) model with fixed effects):
 (5)
(5)
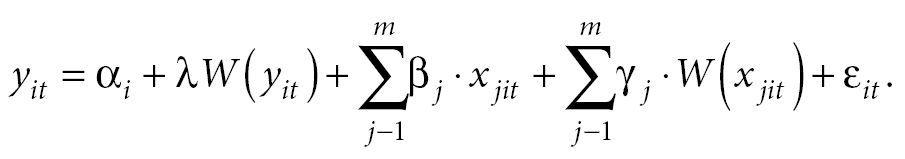
where αi is here and further the constant for region i; βj is here and further the vector-coefficient with explanatory variable j; xjit is here and further an element of the matrix of explanatory variables; γj is the coefficient at the spatial lag of the explanatory variable; W (xit) is spatial lag of explanatory variable j in region i at time t ; εit is here and further random errors.
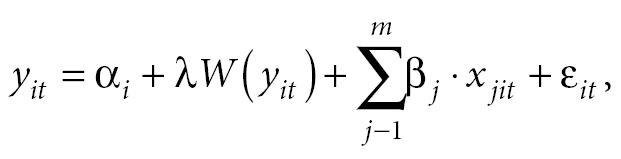
- Spatial lag model (SAM) with fixed effects (Spatial lag model (SAM) with fixed effects):
 (5)
(5)
where is the coefficient at spatial lag; W (xit) is the spatial lag of the dependent variable for region i at time t.
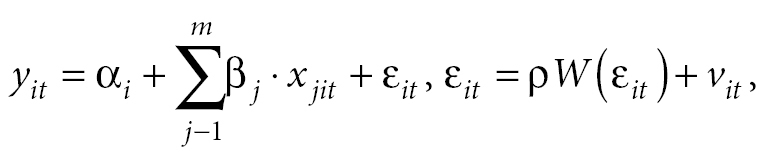
- Spatial error model (SEM) with fixed effects:
 (6)
(6)
where ρ is the spatial factor; W (εit) is spatial lag of the standard error in region i at time t; vit is a random error.
- Spatial Durbin model with fixed effects:
 (7)
(7)
For analysis, we decided to build three specifications of spatial models. The first specification is a model with a spatial lag of the dependent variable: the high rate of births using IVF in the region may be, firstly, a signal of the use of the technology, resulting in a network effect (the more people use the technology, the more new people learn about it) and increased demand from those who had previously been in doubt both within the region and in neighbouring regions; it may be a signal of increased use of the technology in the region and attract “reproductive migration”, thirdly, it may reflect hidden characteristics of quality of service delivery that were not considered by us in the basic model specification. The second specification is a model with a spatial lag of the number of clinics: the more clinics in nearby regions, the higher the proportion of births using technology in the region. The third specification is the Darbin model with the inclusion of both spatial lag of the dependent and explanatory variable.
Note that the evaluation of spatial models in RStudio requires a balanced panel, so we had to exclude data for five regions from the analysis: for the Ivanovo oblast there are no data on female infertility for 2016, for the Republic of Crimea and Sevastopol the data are available until 2015, for the Republic of Ingushetia the data on female infertility for 2014 and for the Chechen Republic – Gini Index data for 2010-2011 and Internet access data for 2010-2013 are unavailable. As a result, a balanced panel for 2011-2017 in 80 regions of the Russian Federation was obtained for analysis.
Discussing the results
The results of the evaluation of the proposed specifications are given in Table
Results of the evaluation of spatial models on panel data, dependent variable: proportion of children born using ART in total number of live births
| Model with spatial lag of the dependent variable | Model with spatial lag of the number of clinics | Darbin model | |
| (1) | (2) | (3) | |
| Dependent variable spatial lag | 0,69*** | 0,65*** | |
| (0,06) | (0,06) | ||
| Spatial Lag Number of Clinics | 2,61*** | 1,62*** | |
| (0,63) | (0,55) | ||
| Inclusion in MHI | −1,96*** | −2,29*** | −2,13*** |
| (0,48) | (0,57) | (0,48) | |
| Inclusion in MHI* income | 0,22*** | 0,25*** | 0,24*** |
| (0,07) | (0,08) | (0,07) | |
| Inclusion in MHI* inequality | −0,34 | 0.24 | −0,3 |
| (1,08) | (1,27) | (1,07) | |
| Income inequality | −0,22 | 0.22 | −0,35 |
| (0,22) | (0,27) | (0,23) | |
| Percentage of population in cities where ART is available | −1,47 | −5,2*** | −1 |
| (1,56) | (1,81) | (1,57) | |
| Percentage of employment with higher education | 1,12* | 1,44** | 0.93 |
| (0,58) | (0,69) | (0,58) | |
| Percentage of population with access to the Internet | 0,24* | 0,49*** | 0.11 |
| (0,14) | (0,17) | (0,15) | |
| Control variables | + | + | + |
| Number of observations | 560 | 560 | 560 |
| LogLik | 152.45 | 156.9 | |
| AIC | −104,89 | −111,8 | |
| Adj. R2 | 0.806 |
Most of the variables significant in the basic specification remained significant in spatial models as well: the inclusion of IVF in the MHI programme (-), the covariate of inclusion of IVF in MHI and income (+), the share of employees with higher education in the total number of employed (+ in two models out of three), the proportion of those with access to the Internet (in two models out of three). Note that the coefficient for the income variable after the inclusion of IVF in the programme of state guarantees in models taking into account spatial relationships is greater in absolute value, i.e. these models give a stronger evaluation of the contribution of income.
The choice of model for interpretation is complicated by the use of both panel data and assessment using the maximum likelihood method (except for the spatial lag model of the explanatory variable, which is rated as a conventional fixed effects model). For comparing the models, the logarithm of maximum likelihood (the larger it is, the better the model) and information criteria of Akaike or Schwartz (the smaller they are, the better) are used. By these criteria, the spatial distribution is marginally better described by the Darbin model with the inclusion of a spatial lag of both the dependent and explanatory variable of the number of clinics.
We interpret the coefficient of the variable of inclusion of IVF in the MHI programme for this model. On the basis of estimates, we obtain that when IVF is included in MHI ∆Ins = 1 other things being equal:
∆pct_IVF_childreni = –2,13+ 0,24 . ln(Aver_real_incomei),
(9)
where ∆pct_IVF_childreni is the change in the proportion of children born using ART in the region; ln(Aver_real_incomei), is the logarithm of real average per capita income in the region. Then ∆pct_IVF_childreni > 0 is true for regions where ln(Aver_real_incomei) > 8,88 or in translation into rubles – over 7,187 rubles. When taking into account “reproductive migration” between regions, the threshold of average real income, at which IVF inclusion in MHI begins to have a positive impact, is lower than in the basic specification.
Limitations of the study
The first and main limitation of the study is the lack of data on the real distribution of the number of ART procedures and children born with the help of ART in the regions of Russia. Consequently, some of the identified determinants may not be determinants of the proportion of births using ART, but factors of multiple births. So, in a paper by Marina Egorova and Svetlana Pyankova (2010), where the twin birth rate is analyzed, the factors influencing the likelihood of multiple pregnancy – age, constitutional features, fecundity, order of birth – are given. In our models, age can be a factor not only for births using ART, but also for multiple births.
The second limitation of the analysis is an insufficiently long time period. The inclusion of IVF in MHI was relatively recent and was linked in 2013-2015 to constant changes in the financing mechanism of the service and the economic crisis of 2014-2015. For more accurate analysis, we need to evaluate the impact of inclusion on a longer period of time.
The third limitation of the analysis is the lack of research into the factors of the use of ART based on individual data of sample surveys for Russia, some key variables specific to this country may have been missed. Lastly, the fourth constraint is the choice of fixed effects models as an estimation method: some variables have “conditional” volatility in time and their influence may be lost in the process of analysis.
Conclusion
The study found that the inclusion of IVF in MHI did not reduce the impact of inequality on the decision to use the technology. The inclusion of IVF in MHI has had a meaningful effect on the proportion of births with ART only in wealthier regions. In poorer regions, there is a negative effect. Accounting for spatial effects slightly reduces the income threshold, starting from which IVF inclusion in MHI has had a positive impact. Estimates of the income threshold are approximate, so it is impossible to determine the boundary accurately.
The higher the income level in the region, the greater the positive effect of the inclusion of IVF in MHI. Our hypothesis that the inclusion of IVF in MHI reduces inequalities in access has not been confirmed. Income and inequality continue to have an impact on births. Significant social determinants of the use of ART are the accessibility of information about the procedure and the opportunity to use it under the MHI programme, and the level of education of the population. Also, the analysis revealed a significant positive influence of spatial effects on the proportion of births using ART.
The results are stable regarding the choice of method of evaluating the model and replacing some variables with alternate ones. When environmental variables are included, the quality of the model slightly improves, and in some variations, environmental factors have a significant impact. We assume that environmental indicators better reflect the real incidence of infertility than official statistics.
To further expand the availability of IVF covered by MHI, we propose to influence significant determinants of the third level of factors – the level of availability. The first direction of impact is the heterogeneity of the impact of IVF inclusion in MHI depending on the income level. First, the use of IVF funded by MHI entails additional costs for tests before receiving a quota, purchasing medications or additional manipulation that increases the likelihood of pregnancy. Secondly, the decision to have a child using IVF is associated with a sense of financial stability and prosperity. In order to influence this end, programmes to support mothers with children in low-income regions should be developed and the additional costs of IVF that patients encounter should be analyzed regionally, in order to adjust the list of available MHI services.
The second direction of impact is the accessibility of information about the procedure and the possibility of obtaining it via MHI. As measures in this regard, it is proposed, first, to improve and harmonize the quality of information on the websites of regional ministries and health departments, to recommend that public clinics post this information on their websites, since the analysis has shown that often public clinics did not provide information on their websites explicitly.
As a further direction of research, the author is interested in the analysis of territorial programmes of state guarantees of the regions of the Russian Federation for 2013-2014 to identify differences in terms of incorporation and financing of IVF with MHI, perhaps some regions had, after all, introduced the procedure to the State Guarantee Programme later than others; at least such an impression appears after study the websites of clinics. If the assumption is confirmed, the effect of the policy can be assessed by the difference-in-difference method.
Reference list
- Abramowitz J (2014) Turning back the ticking clock: the effect of increased affordability of assisted reproductive technology on women’s marriage timing. Journal of Population Economics 27: 603–633. https://doi.org/10.1007/s00148-013-0487-3
- Abramowitz J (2017) Assisted Reproductive Technology and Women’s Timing of Marriage and Childbearing. Journal of Family and Economic Issues 38: 100–117. https://doi.org/10.1007/s10834-016-9485-4
- Abramowitz J (2019) Effects of Infertility Insurance Mandates on Maternal Mortality. Panel paper presented at the 2019 APPAM Fall Research Conference, November 7−9, Denver CO.
- Adamson GD (2009) Global Cultural and Socioeconomic Factors That Influence Access to Assisted Reproductive Technologies. Women’s Health 5: 351–358. https://doi.org/10.2217/WHE.09.28
- Bedrick BS, Anderson K, Broughton DE, Hamilton B, Jungheim ES (2019) Factors associated with early in vitro fertilization treatment discontinuation. Fertility and Sterility 112: 105–111. https://doi.org/10.1016/j.fertnstert.2019.03.007
- Bennett LR (2017) Infertility and inequity across the globe. Asian Population Studies 13: 1–4. https://doi.org/10.1080/17441730.2016.1176805
- Bitler MP, Schmidt L (2012) Utilization of Infertility Treatments: The Effects of Insurance Mandates. Demography 49: 125–149. https://doi.org/10.2307/41408222
- Buckles KS (2013) Infertility Insurance Mandates and Multiple Births. Health Economics 22: 775–789. https://doi.org/10.1002/hec.2850
- Bundorf MK, Henne M, Baker L (2007) Mandated health insurance benefits and the utilization and outcomes of infertility treatments. Available from: http://www.nber.org/papers/w12820 (April 18, 2020).
- Carré J, Gatimel N, Moreau J, Parinaud J, Léandri R (2017) Does air pollution play a role in infertility?: a systematic review. Environmental health: a global access science source 16: 82. https://doi.org/10.1186/s12940-017-0291-8
- Conforti A, Mascia M, Cioffi G, De Angelis C, Coppola G, De Rosa P, Pivonello R, Alviggi C, De Placido G (2018) Air pollution and female fertility: a systematic review of literature. Reproductive Biology and Endocrinology 16: 117. https://doi.org/10.1186/s12958-018-0433-z
- Crawford S, Boulet SL, Jamieson DJ, Stone C, Mullen J, Kissin DM (2016) Assisted reproductive technology use, embryo transfer practices, and birth outcomes after infertility insurance mandates: New Jersey and Connecticut. Fertility and Sterility 105: 347–355. https://doi.org/10.1016/j.fertnstert.2015.10.009
- Dadaeva TM, Baranova VV (2019) Auxiliary reproductive technologies in the reproductive behaviour of urban youth (experience of aerobatic research). Regionology 27:138—155 https://doi.org/10.15507/2413-1407.106.027.201901.138-155 (in Russian)
- Demidova OA (2013) Identification of spatial effects for the main macroeconomic indicators of Russian regions. NRU HSE. https://economics.hse.ru/data/2013/12/03/1335971579/Demidova_Article_HSE_2013.pdf (in Russian)
- Di Nisio A, Foresta C (2019) Water and soil pollution as determinant of water and food quality/contamination and its impact on male fertility. Reproductive biology and endocrinology: RB&E 17: 4. https://doi.org/10.1186/s12958-018-0449-4
- Egorova MS, Pyankova SD (2010) Dynamics of twin fertility in Russia (1959−2008). Psychological research: digital scientific journal 5:11. (in Russian)
- Fischer MM, Getis A (2009) Handbook of applied spatial analysis: software tools, methods and applications. Springer Science & Business Media.
- Getis A, Aldstadt J (2004) Constructing the spatial weights matrix using a local statistic. Geographical Analysis 36: 90–104. https://doi.org/10.1111/j.1538-4632.2004.tb01127.x
- Hamilton BH, McManus B (2012) The effects of insurance mandates on choices and outcomes in infertility treatment markets. Health Economics 21: 994–1016. https://doi.org/10.1002/hec.1776
- Harris R, Moffat J, Kravtsova V (2011) In Search of ‘W’. Spatial Economic Analysis 6: 249–270. https://doi.org/10.1080/17421772.2011.586721
- Isupova OG (2017) Auxiliary reproductive technologies: new possibilities. Demographic Review 4:35—64. (in Russian)
- Ivanova V (2019) GRP and environmental pollution in regions of Russia: spatial-econometric analysis. Kvantil 14: 53-62. (in Russian)
- Kocourkova J, Burcin B, Kucera T (2014) Demographic relevancy of increased use of assisted reproduction in European countries. Reproductive Health 11: 37. https://doi.org/10.1186/1742-4755-11-37
- Kolomak EA (2010) Spatial externalities as a resource of economic growth. Region: economics and sociology 4:73—87. (in Russian)
- Kosfeld R (2006) Spatial Econometrics. University of Kassel, Germany.
- Kroeger S, La Mattina G (2017) Assisted reproductive technology and women’s choice to pursue professional careers. Journal of Population Economics 30: 723–769. https://doi.org/10.1007/s00148-016-0630-z
- Kuhnt A-K, Depenbrock E, Unkelbach S (2018) Reproduktionsmedizin und Familiengründung – Potentiale sozialwissenschaftlicher Datensätze in Deutschland. Zeitschrift für Familienforschung 30: 194–215. https://doi.org/10.3224/zff.v30i2.04
- Kulikov AYu, Tishchenko DG, Yagudina RI (2017) Pharmacoeconomic analysis of the remote effects of the wider use of in vitro fertilization in infertility treatment at the regional and federal levels from the perspective of society as a whole and in the Russian Federation. Pharmacoeconomics: theory and practice 1:34—39.
- Kushnir VA, Barad DH, Albertini DF, Darmon SK, Gleicher N (2017) Systematic review of worldwide trends in assisted reproductive technology 2004–2013. Reproductive Biology and Endocrinology 15: 6. https://doi.org/10.1186/s12958-016-0225-2
- Leridon H (2004) Can assisted reproduction technology compensate for the natural decline in fertility with age? A model assessment. Human reproduction (Oxford, England) 19: 1548–53. https://doi.org/10.1093/humrep/deh304
- Lundborg P, Plug E, Rasmussen AW (2017) Can Women Have Children and a Career? IV Evidence from IVF Treatments. American Economic Review 107: 1611–1637. https://doi.org/10.1257/aer.20141467
- Machado MP, Sanz-de-Galdeano A (2015) Coverage of infertility treatment and fertility outcomes. SERIEs 6: 407–439. https://doi.org/10.1007/s13209-015-0135-0
- Mandrik O, Knies S, Severens J (2015) Economic value of in vitro fertilization in Ukraine, Belarus, and Kazakhstan. ClinicoEconomics and Outcomes Research 7: 347−356. https://doi.org/10.2147/CEOR.S79513
- Mascarenhas MN, Flaxman SR, Boerma T, Vanderpoel S, Stevens GA (2012) National, Regional, and Global Trends in Infertility Prevalence Since 1990: A Systematic Analysis of 277 Health Surveys. Low N. (Ed.). PLoS Medicine 9: e1001356. https://doi.org/10.1371/journal.pmed.1001356
- Millo G (2017) A simple randomization test for spatial correlation in the presence of common factors and serial correlation. Regional Science and Urban Economics 66: 28–38. https://doi.org/10.1016/j.regsciurbeco.2017.05.004
- Nifantova RV, Krivenko NV (2014) Reproductive technologies as social innovations in the health care system. Economics of the region 3: 191–197. https://doi.org/10.17059/2014-3-19
- Order of the Ministry of Health of the Russian Federation of 30.08.2012 № 107n “On the procedure for the use of assisted reproductive technologies, contraindications and restrictions to their use”.
- Passport of the National Project “Demography” (approved by the Presidium of the Presidential Council for Strategic Development and National Projects (Minutes No. 16 of 24.12.2018).
- Righarts A, Dickson NP, Parkin L, Gillett WR (2015) Infertility and outcomes for infertile women in Otago and Southland. Available from: https://www.researchgate.net/publication/302945767_Infertility_and_outcomes_for_infertile_women_in_Otago_and_Southland (March 10, 2020).
- Rusanova NE (2013) Auxiliary reproductive technologies in Russia: history, problems, demographic perspectives. Journal of Social Policy Research 11:69-86. (in Russian)
- Rusanova NE, Gordeeva VL (2016) Auxiliary reproductive technologies: needs and regulation at low fertility. Population 3: 34-46. (in Russian)
- Sarac M, Koc I (2018) Prevalence and risk factors of infertility in Turkey: evidence from demographic and health surveys, 1993−2013. Journal of Biosocial Science 50: 472–490. https://doi.org/10.1017/S0021932017000244
- Schmidt L (2005) Infertility Insurance Mandates and Fertility. American Economic Review 95: 204–208.
- Schmidt L (2007) Effects of infertility insurance mandates on fertility. Journal of Health Economics 26: 431–446. https://doi.org/10.1016/j.jhealeco.2006.10.012
- Settumba SN, Shanahan M, Botha W, Ramli MZ, Chambers GM (2019) Reliability and Validity of the Contingent Valuation Method for Estimating Willingness to Pay: A Case of In Vitro Fertilisation. Applied Health Economics and Health Policy 17: 103–110. https://doi.org/10.1007/s40258-018-0433-3
- Thonneau P, Spira A (1990) Prevalence of infertility: international of measurement. European Journal of Obstetrics & Gynecology and Reproductive Biology 38: 43–52.
- Vakulenko ES, Mkrtchyan NV, Furmanov KK (2012) Interregional migration in Russia: modelling of communication with socio-economic indicators and influence of the distance factor / XII Conference on Economic and Social Development NRU HSE. (1): 334—338. (in Russian)
- Vasilieva TS, Peregontseva NV (2016) Fertility indicators and new reproductive technologies in the practice of health care at the municipal level. Vestnik Smolenskoy State Medical Academy 15: 36−39. (in Russian)
- Wu B (2019) Information presentation and consumer choice: Evidence from Assisted Reproductive Technology (ART) Success Rate Reports. Health Economics 28: 868–883. https://doi.org/10.1002/hec.3900
Data Sources
- National Environmental Rating of the Russian regions.
- Register of the Russian Association of Human Reproduction.
- Federal Research Institute for Health Organization and Informatics of Ministry of Health of the Russian Federation.
- Federal State Statistics Service data, Russia.
- Centers for Disease Sontrol and Prevention, USA.
- National Vital Statistics Report (CDC), USA.
Information about the author
Alexandra Moskaleva, postgraduate student at Mathematical and Instrumental Methods of Economics programme, Engineer of the Admissions Department, Faculty of Economics of Lomonosov Moscow State University. E-mail: saschamosk@gmail.com