|
Corresponding author: Victoria V. Fokina ( viktoriaf2010@mail.ru ) © 2021 Victoria V. Fokina.
This is an open access article distributed under the terms of the Creative Commons Attribution License (CC BY 4.0), which permits unrestricted use, distribution, and reproduction in any medium, provided the original author and source are credited.
Citation:
Fokina VV (2021) Relationship between vulnerability and life satisfaction in older population in Russia. Population and Economics 5(4): 66-92. https://doi.org/10.3897/popecon.5.e73669
|
Abstract
The article examines the relationship between various components of vulnerability and life satisfaction among older people in Russia. Empirically, the study bases on data from the first wave of the WHO Study on Global Ageing and Adult Health (SAGE) for 2007–2010. The analysis showed that physical vulnerability, or frailty, is associated with a significantly lower level of life satisfaction of the older population. At the same time, there are differences in this relationship between age groups, and an increase in the physical vulnerability of individuals aged 75–89 years old reduces their subjective well-being to a greater extent in comparison with the group of individuals aged 60–74 years old. The financial situation of individuals also plays a significant role: lack of income to cover daily needs negatively affects subjective well-being. Socializing with friends is another predictor of life satisfaction in older age.
Keywords
Frailty Index, Russia, population ageing, older age, life satisfaction, vulnerability, WHO SAGE
Introduction
The proportion of the elderly in the total population of the world is increasing every year. The simultaneous rise in life expectancy and the decline in the fertility rate determine the ageing of the population. According to projections provided by the United Nations (UN), by 2050, 16% of the world’s population will be aged over 65 years (United Nations 2020).
The issue of population ageing is also relevant for Russia. According to the Federal State Statistics Service (Rosstat), the median age of the Russian population is growing, and at the beginning of 2020 the share of people aged over of 60 years was 22.4%, and over 65 years — 15.5%. For comparison, in 2002, these proportions were 18.5% and 13.0%, respectively. In the future, the share of the elderly is expected to increase even more. In accordance with the high demographic forecast, by 2036, the share of the population older than the working age in Russia will reach 24.7%, and every fifth individual will be a representative of the older age. According to the World Health Organization (WHO), in Russia, an increase in the number of the elderly is accompanied by increase in life expectancy at older ages. For example, in 2019, life expectancy at the age of 60 was 19.9 years, while in 2000 this indicator reached only 16.4 years.
However, a longer life does not always mean a healthy one, and additional years spent in an unhealthy state usually do not provide any new life opportunities. Due to age-related physiological changes, elderly individuals are more susceptible to the risk of chronic diseases and the decrease in the level of functional activity. They also often face cognitive problems, which imposes certain restrictions on their physical and social activity. In addition, deteriorating health can have a negative impact on life satisfaction in older people (
According to the definition presented in the Constitution of WHO, “health is a state of complete physical, mental and social well-being and not merely the absence of disease or infirmity” (World Health Organization 2014: 1). Thereafter, the restrictions present in the life of older persons which affect their health can also be not only physical, but also social or material in their nature. The presence of at least one or a number of such restrictions causes increased susceptibility of the individual to external and internal changes, or so-called vulnerability.
There are various approaches to defining vulnerability in literature. As stated in (No Secrets 2000: 8–9), an individual is considered vulnerable when he or she “is or may be in need of community care services by reason of mental or other disability, age or illness; and who is or may be unable to take care of him or herself, or unable to protect him or herself against significant harm or exploitation”. At the same time, harm can mean both abuse and the assumption of a preventable deterioration in physical or mental health, and exploitation can mean financial and other abuse of individuals’ vulnerability.
Vulnerability might manifest itself at any age, but generally this condition is most often associated with older ages. When considering this population group, some scholars regard vulnerability as a consequence of frailty (
Vulnerability can arise for various reasons, including economic, social, and other factors. The high degree of vulnerability of older people can be due to a lack of communication with family and friends, lack of support from others, poor financial situation, or low quality of available resources. Thus, vulnerability can be considered as a combination of individual and external factors, including both biological frailty, and social and other aspects, the timely identification and understanding of which is necessary for the comprehensive care of older persons.
Despite the fact that vulnerability is common among older people, and there are many papers that regard the effect of its various components on life satisfaction, the issue of the existing differences in the impact of physical vulnerability on life satisfaction in older age groups remains understudied. Moreover, there are few works concerning the influence of various social, economic, and other factors on the subjective well-being of elderly individuals in Russia (
Life satisfaction within the framework of this study is considered as “the degree to which a person positively evaluates the overall quality of his/her life as-a-whole” (
The aim of this study is to evaluate the relationship between vulnerability and life satisfaction among older people in Russia. To achieve this goal, the first part of the article provides an overview of the relevant literature, identifies the main indicators of life satisfaction and puts forward hypotheses for testing. Then, in the empirical part of the article, the author carries out a regression analysis basing on the WHO Study on Global Ageing and Adult Health (WHO SAGE) data for 2007–2010. The final part of the article presents the main results of the study.
1. Literature review
Social component of vulnerability and life satisfaction
The social component of vulnerability, reflecting the individual’s involvement in social relations and the conditions of the individual’s social life, can act as a predictor of subjective well-being. At that, the lack or complete absence of social bonds can lead to vulnerability. (
(
Financial component of vulnerability and life satisfaction
Financial well-being also acts as a factor of vulnerability. For older people, the problem of a lack of financial resources may be relevant due to the fact that with retirement, individual incomes can sharply decline. In this regard, for some of the elderly continuing to work and maintaining employment status becomes a necessity, which can lead to a deterioration in the quality of life, despite the additional income.
In (
Nevertheless, the relationship between the indicators under consideration is not always present. For example, (Pimquart and Sörensen 2020) found a weak correlation between life satisfaction and income. The authors attribute this result to the fact that older individuals adjust their needs to financial constraints.
Physical component of vulnerability and life satisfaction
(
At the same time, in (
Individual economic and socio-demographic characteristics and life satisfaction
The aim of this study is to assess the impact of vulnerability on life satisfaction of older persons, however, for a more accurate consideration of this relationship, it is necessary to take into account the influence of other individual socio-demographic characteristics, for example, sex, age, place of residence, and marital status, which also often act as predictors of the level of subjective well-being.
In (
(
Marital status can also be a predictor of life satisfaction: when looking at a subsample of men, (
The same study failed to confirm the hypothesis about the influence of place of residence on life satisfaction (ibid.). However, (
Thus, individual characteristics can have a significant impact on life satisfaction and excluding them can lead to biased estimates in empirical analysis of subjective well-being.
Research hypotheses
In the course of systematizing research on the impact of vulnerability on life satisfaction, we considered the main components of vulnerability: social, financial, and physical. As a result of the analysis of previous studies, the following hypotheses were formulated for testing on Russian data:
Hypothesis 1. The frequency of contact with friends is positively associated with the life satisfaction of older people.
Hypothesis 2. The better the financial situation of older people, the higher their life satisfaction.
Hypothesis 3. Frailty is negatively associated with life satisfaction among older people.
Hypothesis 4. There are significant differences in the effect of frailty on life satisfaction in different age groups.
The empirical analysis bases on the spatial data of the first wave of the WHO Study on Global Ageing and Adult Health (WHO SAGE), conducted in Russia in 2007–2010.
2. Empirical basis of the study
The first wave of the WHO Study on Global Ageing and Adult Health includes the responses of 4,947 respondents, of whom 436 were in the 18–49 age group at the time of the survey; the study is representative at the country level.
During the preliminary analysis of the data, individuals whose age at the time of the survey was less than 49 years old, as well as 90 years or over, were excluded from the sample. Individuals under 50 years of age were excluded from the sample since they could not be attributed to the elderly. Those aged 90 years old and over (23 observations) were excluded from the sample in order to avoid bias in estimates. Individuals aged 50–59 years are regarded as a pre-retirement age group. The final sample consists of 2,640 respondents.
The models estimated in the study, in addition to vulnerability, include the main economic, social and demographic variables that can influence the life satisfaction of older people, namely, age, gender, place of residence, marital status, number of family members, and education.
To conduct the empirical analysis, it was necessary to select questions that enable assessing each of the specified individual characteristics, as well as to adapt them in order to simplify the analysis and interpretation. To do this, the author used the data of an individual questionnaire of the WHO SAGE, which includes information on demographic and socio-economic characteristics. Variables for the number of individuals living in the household and place of residence were added from the household questionnaire. Table
During preprocessing, discrete variables such as life satisfaction and financial situation were re-coded in the reverse order, where “1” states for the the least favourable of all possible outcomes, and “5” stands for the most favourable. For example, the answer to the question “Taking all things together, how satisfied are you with your life as a whole these days?” is used as a dependent variable, and “1” stands for “Very dissatisfied”, while “5” — for “Very satisfied”.
Predicted probabilities of falling into the group of those satisfied and dissatisfied with their life when considering the 25th and 75th percentiles of the frailty index
| Groups | Life satisfaction = 0 | Life satisfaction = 1 |
| 25th percentile of the Frailty Index | 0.281*** | 0.719*** |
| (0.016) | (0.016) | |
| 75th percentile of the Frailty Index | 0.518*** | 0.482*** |
| (0.016) | (0.016) |
Based on the answer to the question about marital status, three binary variables were created: widowed, cohabiting, alone, reflecting being in the status of a widow or widower, having a partner or not having a partner due to divorce or for other reasons, respectively. The answer to the question: “Have you worked for at least 2 days during the last 7 days?” is used as a proxy variable for the availability of work, where “1” means a positive answer to the given question, and “0” means a negative one.
The answers to the question about the highest educational level attained were also divided into four dummy variables. A value of one of the variables primary or less, secondary, high, graduate equal to 1 indicates the presence of the highest level of education at the primary school level and below or at the level of secondary school, high school, or higher (professional) education, respectively. In addition, to implement the empirical strategy and test the hypotheses given above, variables such as body mass index, age groups of 50–59, 60–74, and 75–89 years, and the Frailty Index were constructed.
To take into account the social activity of an individual, two variables are included in the list of control indicators, reflecting the frequency of personal contacts and the degree of participation in public life. They were re-coded into binary, where, for example, “1” means meeting friends more often than twice a year. The frequency of communication with friends is assessed based on the question “How often in the last 12 months have you had friends over to your home?”; and the following question is used as a proxy for public life: “How often in the last 12 months have you attended any group, club, society, union, or organizational meeting?”
To assess the financial component of vulnerability, it is necessary to have data on the amount of income of each individual or household. Since many individuals did not answer this question, and the variable has many missing values, the author decided to use the question of the adequacy of income to cover daily needs as a proxy for the financial component of vulnerability. For ease of interpretation, the original values have been re-coded in the reverse order, where “1” means insufficient funds and “5” means funds sufficient to fully cover needs. In addition, for control, it was decided to include a variable reflecting the objective financial situation, namely, the welfare quintile. It was assessed based on information on the availability of durable goods as well as characteristics of the dwelling in which the household lives; “1” means belonging to the quintile with the lowest wealth and “5” — to the quintile with the highest wealth.
To assess the physical component of vulnerability, it was decided to use the Frailty Index, which includes variables reflecting difficulties in functional activity, the number of diagnosed diseases, and an assessment of one’s own health. Indicators reflecting the mental component, including depressive disorders and cognitive impairment, are also added to the index calculation and considered through frailty.
3. Results
Descriptive statistics
Tables
Most of the considered individuals live in urban areas (77%), have high school education or equivalent (52%) and live with a partner (60%). In addition, 63% of individuals are unemployed. 15% of the respondents in the sample have a household member in need of additional support.
Individuals in the sample generally note that they have sufficient income to cover their own needs. When considering variables related to the social component, we observe low participation in public life: in the past year, 93% of individuals attended groups, clubs, societies, and other social events no more than twice.
Frailty Index calculation
Within the framework of this study, the physical component of vulnerability is measured using the Frailty Index presented in (
The authors of the above-mentioned studies note that this index is significantly associated with an increased risk of death when at least 30 variables are included in the calculation. The more parameters are taken into account when calculating the index, the higher the accuracy of the frailty assessment, while the inclusion of less than 10 indicators in the calculation does not allow obtaining a stable assessment. However, the variables included in the calculation must meet several conditions. First, deficits must be related to the health of the individual. Second, the occurrence of deficits should be positively associated with age. In addition, the deficits should not be massively manifested too early, and their combination should cover various indicators of an individual’s health, not just any one of its components such as, for example, mental health.
To assess the vulnerability components, the variables presented in the authors’ original methodology were compared with the indicators available in the WHO SAGE spatial data. Taking into account the results of previous studies and the criteria for selecting variables, the author picked 39 indicators representing 6 main domains:
- general health indicators;
- medical symptoms;
- functional performance indicators;
- indicators of daily activities;
- diagnosed diseases;
- body mass index.
The number of variables included in the calculation of the Frailty Index is defined by the availability of the necessary information in the WHO SAGE questionnaire, their compliance with the above-mentioned criteria, as well as the number of missing answers within each indicator. Similar variables were included in the calculation by other authors when assessing frailty using data from the WHO SAGE (
In the course of the data processing, the variables were re-coded in accordance with the recommendations for calculating the Frailty Index presented in the literature. Thus, general health was considered through self-assessment, where “0” means very good, and “1” — very poor health. Medical symptoms, such as memory impairment, physical pain, problems with sleep and vision (at short and long distances), were evaluated in a similar way.
The assessment of daily activities was carried out on the basis of the following indicators: difficulties in getting dressed, when washing and bathing, when getting up from a lying position, and others. To assess functional activity, the author considered difficulties in walking a distance of 100 m, climbing a flight of stairs, and some other activities. 9 variables responsible for the presence of diagnosed diseases, for example, arthritis, stroke, diabetes, and others were reduced to a binary form, where “1” means the presence of a diagnosed disease, and “0” — absence of a diagnosis.
To calculate the body mass index (BMI), a generally accepted formula was used, according to which the respondent’s weight in kilograms must be divided by the respondent’s height in meters squared. Then, depending on the obtained value, the presence of under- or overweight (“1”) or absence of this health deficit (“0”) was determined. If the calculated value of the body mass index turned out to be less than 18.5 or more than 30, then it was assigned a value of 1, and with an index from 25 to 30 — 0.5. The rest of the values, defined as the norm, were assigned to 0.
The Frailty Index is estimated as the arithmetic mean of all indicators, where the sum of all accumulated deficits is divided by their number. Given the number of variables used in this article, the formula can be rewritten as follows:
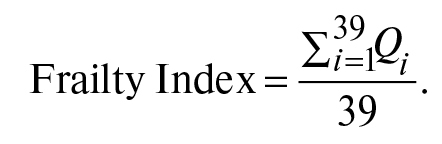 (formula 1)
Thus, the frailty index was calculated for each of 2,640 individuals aged 50–89 years old.
Econometric model
To test the study hypotheses, the author estimated models introducing the Frailty Index, as well as indicators of social and financial vulnerability, as the controls. In addition, to test Hypothesis 4, the author constructed auxiliary regressors, which are the product of a binary variable of an individual’s belonging to a particular age group and the corresponding value of the Frailty Index. In order to prevent multicollinearity, some of the variables were excluded from the models; namely, these are the binary variables reflecting the presence of a partner, high school education, and age group of 60–74 years old which act as reference groups when considering marital status, education, and age group, respectively. All regressions were constructed using robust standard errors.
As a first step, the author estimated the following OLS model:
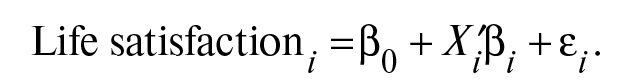 (formula 2)
In the presented model, on the left, Life satisfaction is the dependent variable, and Xi is a vector of regressors that includes both indicators of vulnerability and individual demographic and socio-economic characteristics of individuals.
Taking into account the discrete form of the dependent variable and the results of earlier studies, the author of the study also estimates ordered choice models where the probability that life satisfaction will take one of the values from 1 to 5 is calculated using the normal or logistic distribution function.
Table
According to the obtained results, the significance and direction of influence of almost each of the variables on life satisfaction are robust across the models. Since the dependent variable is discrete and the proportion of correctly predicted outcomes was slightly higher for the ordered logit model, further interpretation of the results is carried out on its basis.
Results of the regression analysis
Evaluation of the regression models showed that vulnerability has a significant impact on life satisfaction in older people. In Table
The results of the regression analysis support three out of four hypotheses of the study: about the influence of the frequency of meetings with friends, financial situation, and frailty on subjective well-being. Thus, greater involvement in social life and communication with friends is associated with higher levels of life satisfaction at an older age. The ordered logit model shows that regular interaction with friends is associated with a higher probability of being in the group of more satisfied individuals: it is 5.6 percentage points higher than in the group of those who meet with their friends less frequently. At the same time, a more active social life is not a significant predictor of subjective well-being. In addition, the presence in the household of an individual in need of care or support is negatively associated with life satisfaction of older persons: the likelihood of being included in the group of those who are more likely to be dissatisfied with life in this group is 2 percentage points higher than of those who do not have a relative who is in the need of care.
Hypothesis 2 is confirmed — a significant relationship is revealed between financial position (as an indicator of financial vulnerability) and life satisfaction: the higher it is, the higher the likelihood of falling into a group with high subjective well-being, while the lack of funds to cover daily needs is associated with a lower probability of being satisfied with life. An increase in the likelihood of being among the most satisfied with life by 1.6 percentage points is observed when the material well-being quintile changes from minimum to maximum, i.e., when there is a significant improvement in living conditions. At the same time, having a job negatively affects life satisfaction, and this relationship is significant at a 10% level.
Frailty is negatively associated with life satisfaction: the higher the frailty of older persons, the lower their assessment of subjective well-being. With an increase in the frailty index by 0.1, there is a decrease in the likelihood of falling into the group of those who are satisfied with life by 10 percentage points.
Hypothesis 4 on the presence of differences in the impact of vulnerability on life satisfaction among representatives of different age groups is confirmed only partially, for the group of elderly individuals and at a 5% significance level. Thus, all other things being equal, an increase in the physical vulnerability of individuals at the age of 75–89 years old has a greater negative effect on their subjective well-being in comparison with the group of individuals at the age of 60–74 years old.
Since it was frailty as an indicator of physical vulnerability that turned out to be the variable that most strongly differentiates life satisfaction among older people, the author additionally considers differences in probabilities of falling into groups with high and low levels of subjective well-being across frailty groups. In order to obtain more coherent results, the dependent variable was converted to a binary form: the value “1” was assigned to groups that noted that they were “satisfied” (4) or “very satisfied” with their life (5), and “0” — to those who reported the value of 1, 2, or 3 in the question about life satisfaction. To estimate the predicted probability in the regressions, the author calculated average values of the Frailty Index for the first and third quartiles (25th and 75th percentiles) of frailty and averaged the individual indicators.
The predicted probabilities are shown in Table
The analysis revealed that the strongest relationship with life satisfaction among older people is observed for vulnerability factors, while the relationship between individual demographic and socio-economic variables and life satisfaction is weak. Place of residence turns out to be a significant factor: living in a city is associated with a lower probability of choosing an ambiguous answer (yes and no) about life satisfaction in comparison with living in rural areas.
4. Discussion and research limitations
The results obtained in the study confirm the hypothesis about the relationship between the physical, social, and financial components of vulnerability and life satisfaction, which is largely consistent with the results presented in the works of other authors. Thus, the study reveals that frailty, calculated on the basis of individual health indicators, is negatively associated with the subjective well-being of older people, which confirms the conclusions presented in (St John et al. 2013). In addition, the study reveals differences in the relationship between the physical component of vulnerability and life satisfaction of older people: the values of the coefficients for the frailty indicator are higher for older people. This differs from the results presented in (
A significant positive relationship between life satisfaction of the older population was also found with financial position (as an indicator of financial vulnerability), which is consistent with the results in (
The performed modelling did not find any significant relationship between education and subjective well-being, which is consistent with the results presented in (
The results of this study have some limitations. Firstly, the performed analysis enables speaking only of a correlation, since a two-way causal relationship is possible between the variables under consideration. Secondly, the authoruses spatial data for 2007–2010 as an empirical base, while in order to examine the dynamics and study the impact of vulnerability on life satisfaction over time, it is necessary to use panel data. The estimates obtained in the empirical part of the study might be biased due to differences in the perception of survey questions and the subjectivity of the answers regarding both the assessment of health and the definition of well-being, as well as other indicators. Consideration of objective measures can potentially be one way to address this limitation. Also, within the framework of the study, a limited set of variables is considered as a vulnerability component due to the availability of a small number of relevant indicators in the questionnaire, as well as a large number of omissions for some variables. In the future, the list of indicators included in the calculation of the Frailty Index can be expanded; moreover, the social vulnerability index, which includes more than 30 variables that are not available in this study, could be introduced into the model. The limitations mentioned in the work may become a starting point for future research.
Conclusion
Population ageing is associated not only with challenges, but also with new opportunities for society. However, to use these opportunities, it is necessary to carry out practical measures aimed at improving population health, creating comfortable conditions for the elderly, and ensuring a certain level of financial and social well-being to improve the quality of their life.
This study shows that vulnerability is significantly associated with the subjective well-being of older Russian population. At the same time, there are differences in the influence between age groups, and an increase in the physical vulnerability of individuals aged 75–89 years old reduces their subjective well-being to a greater extent in comparison with the group of individuals aged 60–74 years old.
Thus, reducing the level of vulnerability of older people is an important prerequisite for increasing life satisfaction of the elderly in Russia. Further study of this issue is necessary for the development of social policies to reduce and mitigate the negative impact of vulnerability on life satisfaction among older people.
The results of this study can be useful for identifying the main directions of policies aimed at increasing life satisfaction of the elderly. For example, one of the measures might be developing special programmes for older people at fitness centers; these programmes could reduce the likelihood of frailty (
In addition, the study found that social engagement, including socialising with friends, is a significant factor of life satisfaction in older people. In this regard, one of the measures aimed at increasing the level of well-being could be the creation of leisure centers for older people in order to organize the infrastructure of acquaintances, create conditions for communication, and raise the social involvement of the elderly.
Since life satisfaction is also significantly related to the financial situation, the issues of pension provision for older people should remain among the priorities on the state agenda.
Finally, another possible focus of the policies increasing the level of subjective well-being of older people is the infrastructural development of territories aimed at creating favourable conditions for maintaining and expanding the opportunities for social activity of older individuals not only in the city, but also in rural areas.
Among promising directions for future research in this area in Russia, in addition to those indicated in the previous section of the article, one can name the assessment of the economic cost of vulnerability in the form of an additional fee arising from the need for treatment or organization of additional care for an individual with a high degree of frailty.
Literature
- Andreenkova A.V., Andreenkova N.V. (2019) Determinanty udovletvorennosti zhizn’yu v Rossii i Evrope: sravnitel’nyi analiz [Comparative analysis of life satisfaction determinants in Russia and in Europe]. Discourse 5(1): 67–81. https://doi.org/10.32603/2412-8562-2019-5-1-67-81
- Berg A.I., Hassing L.B., McClearn G.E., Johansson B. (2006) What matters for life satisfaction in the oldest-old? Aging and Mental Health 10(3): 257–64. https://doi.org/10.1080/13607860500409435
- Biritwum R.B., Minicuci N., Yawson A.E., Theou O., Mensah G.P., Naidoo N., Wu F., Guo Y., Zheng Y., Jiang Y., Maximova T., Kalula S., Arokiasamy P., Salinas-Rodríguez A., Manrique-Espinoza B., Snodgrass J.J., Sterner K.N., Eick G., Liebert M.A., Kowal P. (2016) Prevalence of and factors associated with frailty and disability in older adults from China, Ghana, India, Mexico, Russia and South Africa. Maturitas 91: 8–18. https://doi.org/10.1016/j.maturitas.2016.05.012
- Enkvist Å., Ekström H., Elmståhl S. (2012) What factors affect life satisfaction (LS) among the oldest-old? Archives of Gerontology and Geriatrics 54(1): 140–5. https://doi.org/10.1016/j.archger.2011.03.013
- Guriev S., Zhuravskaya E. (2009) (Un)happiness in transition. Journal of Economic Perspectives 23(2): 143–68. https://doi.org/10.1257/jep.23.2.143
- Gwozdz W., Sousa-Poza A. (2010) Ageing, health and life satisfaction of the oldest old: An analysis for Germany. Social Indicators Research 97(3): 397–417. https://doi.org/10.1007/s11205-009-9508-8
- Harttgen K., Kowal P., Strulik H., Chatterji S., Vollmer S. (2013) Patterns of frailty in older adults: comparing results from higher and lower income countries using the Survey of Health, Ageing and Retirement in Europe (SHARE) and the Study on Global AGEing and Adult Health (SAGE). PloS One 8(10): e75847. https://doi.org/10.1371/journal.pone.0075847
- Hsu Y.-H., Wu C.-H. (2020) Frailty, Socioeconomic Factors, and Life Satisfaction of the Elderly. Journal of Psychology & Behavioral Science 8(1). https://doi.org/10.15640/jpbs.v8n1a3
- Ko H., Jung S. (2021) Association of social frailty with physical health, cognitive function, psychological health, and life satisfaction in community-dwelling older Koreans. International Journal of Environmental Research and Public Health 18(2), 818. https://doi.org/10.3390/ijerph18020818
- Kolosnitsyna M., Khorkina N., Dorzhiev K. (2014) What Happens to Happiness When People Get Older? Socio-Economic Determinants of Life Satisfaction in Later Life. Higher School of Economics Research Paper No. WP BRP 68/EC/2014. https://doi.org/10.2139/ssrn.2515730
- Morley J.E., Vellas B., Abellan van Kan G., Anker S.D., Bauer J.M., Bernabei R., Cesari M., Chumlea W.C., Doehner W., Evans J., Fried L.P., Guralnik J.M., Katz P.R., Malmstrom T.K., McCarter R.J., Gutierrez Robledo L. M., Rockwood K., von Haehling S., Vandewoude M.F., Walston J. (2013) Frailty consensus: A call to action. Journal of the American Medical Directors Association 14(6): 392–7. https://doi.org/10.1016/j.jamda.2013.03.022
- Pinquart M., Sörensen S. (2000) Influences of socioeconomic status, social network, and competence on subjective well-being in later life: A meta-analysis. Psychology and Aging 15(2): 187–224. https://doi.org/10.1037/0882-7974.15.2.187
- Rockwood K., Song X., MacKnight C., Bergman H., Hogan D.B., McDowell I., Mitnitski A. (2005) A global clinical measure of fitness and frailty in elderly people . Comparative Media Arts Journal 173(5): 489–95. https://doi.org/10.1503/cmaj.050051
- Searle S.D., Mitnitski A., Gahbauer E.A., Gill T.M., Rockwood K. (2008) A standard procedure for creating a frailty index. BMC Geriatrics 8(24). https://doi.org/10.1186/1471-2318-8-24
- St John P.D., Tyas S.L., Montgomery P.R. (2013) Life satisfaction and frailty in community-based older adults: Cross-sectional and prospective analyses. International Psychogeriatrics 25(10): 1709–16. https://doi.org/10.1017/S1041610213000902
- Strawbridge W.J., Shema S.J., Balfour J.L., Higby H.R., Kaplan G.A. (1998) Antecedents of frailty over three decades in an older cohort. Journals of Gerontology. Series B 53B(1): S9–S16. https://doi.org/10.1093/geronb/53B.1.S9
- Veenhoven R. (1996) The study of life satisfaction. In: W.E. Saris, R. Veenhoven, A.C. Scherpenzeel, B. Bunting (Eds.) A comparative study of satisfaction with life in Europe. Budapest: EOtvOs University Press. P. 11–48. URL: https://personal.eur.nl/veenhoven/Pub1990s/96d-full.pdf
- Wallace T.J. (2008) Life satisfaction in individuals age sixty-five years of age and older. In: Dissertation Abstracts International: Section B: The Sciences and Engineering (Vol. 69, Issues 12-B).
- Yang F., Gu D., Mitnitski A. (2016) Frailty and life satisfaction in Shanghai older adults: The roles of age and social vulnerability. Archives of Gerontology and Geriatrics 67: 68–73. https://doi.org/10.1016/j.archger.2016.07.001
- Zaidi S., Alam A., Mitra P., Sundaram R. (2009) . Satisfaction with Life and Service Delivery in Eastern Europe and the Former Soviet Union. World Bank Working Paper No. 162. https://doi.org/10.1596/978-0-8213-7900-4
Other data sources
- No Secrets (2000) Guidance on Developing and Implementing Multi‐agency Policies and Procedures to Protect Vulnerable Adults from Abuse. UK Department of Health. URL: https://www.dignityincare.org.uk/_assets/Resources/Dignity/OtherOrganisation/No_Secrets.pdf
- United Nations, Department of Economic and Social Affairs, Population Division. (2020) World Population Ageing 2019 (ST/ESA/SER.A/444). URL: https://www.un.org/en/development/desa/population/publications/pdf/ageing/WorldPopulationAgeing2019-Report.pdf
- World Health Organization. (2010) Study on Global Ageing and Adult Health – 2007/10, Wave 1. Russian Federation. URL: https://apps.who.int/healthinfo/systems/surveydata/index.php/catalog/68
- World Health Organization. (2014) Constitution of the World Health Organization. 48th ed. Geneva: Basic documents of the World Health Organization // Zeitschrift Fur Krankenpflege. Revue Suisse Des Infirmieres, 61(12).
Appendix
| No. in the questionnaire | Variable name | Unit of measurement | Description |
|---|---|---|---|
| Variable of interest | |||
| Q7008 | Life satisfaction | Taking all things together, how satisfied are you with your life as a whole these days? | 1 — Very dissatisfied |
| 2 — Dissatisfied | |||
| 3 — Neither satisfied nor dissatisfied | |||
| 4 — Satisfied | |||
| 5 — Very satisfied | |||
| Individual characteristics | |||
| Q0104 | Setting | Place of residence | 0 — Rural |
| 1 — Urban | |||
| Q0401 | Number of household members | What is the total number of people who live in this household? | Number of persons |
| Q1009 | Sex | Sex of the respondent | 0 — Female |
| 1 — Male | |||
| Q1011 | Age | How old are you now? | Age at last birthday |
| Q1012 | Widow/Widower | What is your current marital status? | 0 — Other |
| 1 — Widow (widower) | |||
| Q1012 | No partner | What is your current marital status? | 0 — Other |
| 1 — Unmarried or separated / divorced | |||
| Q1012 | A spouse / a partner | What is your current marital status? | 0 — Other |
| 1 — Married or living with a partner | |||
| Q1016 | Primary school | What is the highest level of education that you have completed? | 0 — Other |
| 1 — Primary school or lower | |||
| Q1016 | Secondary school | What is the highest level of education that you have completed? | 0 — Other |
| 1 — Secondary school | |||
| Q1016 | High school | What is the highest level of education that you have completed? | 0 — Other |
| 1 — High school (or equivalent) | |||
| Q1016 | Higher education | What is the highest level of education that you have completed? | 0 — Other |
| 1 — Higher education (college / pre-university / university) or higher | |||
| Q1503 | Employment | Have you worked for at least 2 days during the last 7 days? | 0 — No |
| 1 — Yes | |||
| Q8002 | Caring for a relative | Over the last 12 months, have any members of your household, adults or children, needed care or support for any reason? | 0 — No |
| 1 — Yes | |||
| Financial vulnerability | |||
| Q7002 | Financial position | Do you have enough money to meet your needs? | 1 — None at all |
| 2 — A little | |||
| 3 — Moderately | |||
| 4 — Mostly | |||
| 5 — Completely | |||
| Quintile | Wellbeing quintile | Estimated quintile based on available resources | 1 — First quintile |
| 2 — Second quintile | |||
| 3 — Third quintile | |||
| 4 — Fourth quintile | |||
| 5 — Fifth quintile | |||
| Social vulnerability | |||
| Q6003 | Social life | How often in the last 12 months have you attended any group, club, society, union, or organizational meeting? | 0 — Up to 2 times per year |
| 1 — More than 2 times per year | |||
| Q6005 | Meeting friends | How often in the last 12 months have you had friends over to your home? | 0 — Up to 2 times per year |
| 1 — More than 2 times per year | |||
| Constructed variables | |||
| - | Body mass index (BMI). | Calculated value | 0 — 18,5 ≤ BMI < 25 |
| 0,5 — 25 ≤ BMI < 30 | |||
| 1 — BMI < 18,5 or ≥ 30 | |||
| - | Age group 50–59 | Constructed value | 0 — Other age |
| 1 — Aged 50–59 | |||
| - | Age group 60–74 | Constructed value | 0 — Other age |
| 1 — Aged 60–74 | |||
| - | Age group 75–89 | Constructed value | 0 — Other age |
| 1 — Aged 75–89 | |||
| Description | Mean | Standard deviation | Minimum | Maximum |
| Age (years) | 63.8 | 9.64 | 50 | 89 |
| Number of household members | 2.5 | 1.6 | 1 | 13 |
| Description | Answer options | % | Absolute number |
|---|---|---|---|
| Life satisfaction | Very dissatisfied | 1 | 23 |
| Dissatisfied | 8 | 203 | |
| Neither satisfied nor dissatisfied | 31 | 830 | |
| Satisfied | 57 | 1508 | |
| Very satisfied | 3 | 76 | |
| Gender | Female | 63 | 1656 |
| Male | 37 | 984 | |
| Age group | 50–59 | 42 | 1110 |
| 60–74 | 41 | 1091 | |
| 75–89 | 17 | 439 | |
| Place of residence | Urban area | 77 | 2036 |
| Countryside | 23 | 604 | |
| Education | Primary school or lower | 8 | 209 |
| Secondary school | 18 | 480 | |
| High school (or equivalent) | 52 | 1375 | |
| Higher education (college / pre-university / university) or higher | 22 | 576 | |
| Marital status | Unmarried or separated / divorced | 12 | 308 |
| Widow / Widower | 29 | 757 | |
| Married or living with a partner | 60 | 1575 | |
| Employment | Yes | 37 | 987 |
| No | 63 | 1653 | |
| Quintile | First quintile | 16 | 428 |
| Second quintile | 20 | 527 | |
| Third quintile | 20 | 522 | |
| Fourth quintile | 20 | 536 | |
| Fifth quintile | 24 | 627 | |
| Financial position | Not sufficient | 14 | 380 |
| A little sufficient | 16 | 411 | |
| Moderately sufficient | 31 | 828 | |
| Mostly sufficient | 28 | 753 | |
| Completely sufficient | 10 | 268 | |
| Socializing with friends | Up to 2 times per year | 51 | 1334 |
| More often than 2 times per year | 49 | 1306 | |
| Social life | Up to 2 times per year | 93 | 2451 |
| More often than 2 times per year | 7 | 189 | |
| Caring for a relative | No | 85 | 2249 |
| Yes | 15 | 391 |
| No. in the questionnaire | Variable name | Question | Description |
|---|---|---|---|
| General health (1) | |||
| Q2000 | Health self-assessment | In general, how would you rate your health today? | 0 — Very good |
| 0.25 — Good | |||
| 0.5 — Moderate | |||
| 0.75 — Bad | |||
| 1 — Very bad | |||
| Medical Symptoms (6) | |||
| Q1003 | Change in memory | Compared to 12 months ago, would you say your memory is now better, the same, or worse than it was then? | 0 — Same or better |
| 1 — Worse | |||
| Q2011 | Capability of learning new things | Overall in the last 30 days, how much difficulty did you have in learning a new task? | 0 — None |
| 0.25 — Mild | |||
| 0.5 — Moderate | |||
| 0.75 — Severe | |||
| 1 — Extreme / Cannot do | |||
| Q2007 | Physical pain | Overall in the last 30 days, how much of bodily aches or pains did you have? | 0 — None |
| 0.25 — Mild | |||
| 0.5 — Moderate | |||
| 0.75 — Severe | |||
| 1 — Extreme / Cannot do | |||
| Q2016 | Sleep | Overall in the last 30 days, how much of a problem did you have with sleeping, such as falling asleep, waking up frequently during the night or waking up too early in the morning? | 0 — None |
| 0.25 — Mild | |||
| 0.5 — Moderate | |||
| 0.75 — Severe | |||
| 1 — Extreme / Cannot do | |||
| Q2023 | Vision — long distance | In the last 30 days, how much difficulty did you have in seeing and recognising an object or a person you know across the road (from a distance of about 20 meters)? | 0 — None |
| 0.25 — Mild | |||
| 0.5 — Moderate | |||
| 0.75 — Severe | |||
| 1 — Extreme / Cannot do | |||
| Q2024 | Vision — short distance | In the last 30 days, how much difficulty did you have in seeing and recognising an object at arm’s length (for example, reading)? | 0 — None |
| 0.25 — Mild | |||
| 0.5 — Moderate | |||
| 0.75 — Severe | |||
| 1 — Extreme / Cannot do | |||
| Functional Performance (12) | |||
| Q2025 | Long sitting | In the last 30 days, how much difficulty did you have in sitting for long periods? | 0 — None |
| 0.25 — Mild | |||
| 0.5 — Moderate | |||
| 0.75 — Severe | |||
| 1 — Extreme / Cannot do | |||
| Q2026 | Walking 100 m | In the last 30 days, how much difficulty did you have in walking 100 meters? | 0 — None |
| 0.25 — Mild | |||
| 0.5 — Moderate | |||
| 0.75 — Severe | |||
| 1 — Extreme / Cannot do | |||
| Q2027 | Getting up from a sitting position | In the last 30 days, how much difficulty did you have in standing up from sitting down? | 0 — None |
| 0.25 — Mild | |||
| 0.5 — Moderate | |||
| 0.75 — Severe | |||
| 1 — Extreme / Cannot do | |||
| Q2028 | Long standing | In the last 30 days, how much difficulty did you have in standing for long periods? | 0 — None |
| 0.25 — Mild | |||
| 0.5 — Moderate | |||
| 0.75 — Severe | |||
| 1 — Extreme / Cannot do | |||
| Q2029 | Climbing a flight of stairs | In the last 30 days, how much difficulty did you have with climbing one flight of stairs without resting? |
0 — None |
| 0.25 — Mild | |||
| 0.5 — Moderate | |||
| 0.75 — Severe | |||
| 1 — Extreme / Cannot do | |||
| Q2030 | Stooping | In the last 30 days, how much difficulty did you have with stooping, kneeling or crouching? | 0 — None |
| 0.25 — Mild | |||
| 0.5 — Moderate | |||
| 0.75 — Severe | |||
| 1 — Extreme / Cannot do | |||
| Q2031 | Motor skills | In the last 30 days, how much difficulty did you have picking up things with your fingers (such as picking up a coin from the table)? | 0 — None |
| 0.25 — Mild | |||
| 0.5 — Moderate | |||
| 0.75 — Severe | |||
| 1 — Extreme / Cannot do | |||
| Q2034 | Stretching arms | In the last 30 days, how much difficulty did you have in extending your arms above shoulder level? | 0 — None |
| 0.25 — Mild | |||
| 0.5 — Moderate | |||
| 0.75 — Severe | |||
| 1 — Extreme / Cannot do | |||
| Q2035 | Concentration for 10 minutes | In the last 30 days, how much difficulty did you have in concentrating on doing something for 10 minutes? | 0 — None |
| 0.25 — Mild | |||
| 0.5 — Moderate | |||
| 0.75 — Severe | |||
| 1 — Extreme / Cannot do | |||
| Q2036 | Walking 1 km | In the last 30 days, how much difficulty did you have in walking a long distance such as a kilometer? | 0 — None |
| 0.25 — Mild | |||
| 0.5 — Moderate | |||
| 0.75 — Severe | |||
| 1 — Extreme / Cannot do | |||
| Q2040 | Carrying things | In the last 30 days, how much difficulty did you have with carrying things? | 0 — None |
| 0.25 — Mild | |||
| 0.5 — Moderate | |||
| 0.75 — Severe | |||
| 1 — Extreme / Cannot do | |||
| Q2046 | Getting out of home | In the last 30 days, how much difficulty did you have getting out of your home? | 0 — None |
| 0.25 — Mild | |||
| 0.5 — Moderate | |||
| 0.75 — Severe | |||
| 1 — Extreme / Cannot do | |||
| Indicators of daily activity (10) | |||
| Q2032 | Household duties | In the last 30 days, how much difficulty did you have in taking care of your household responsibilities? | 0 — None |
| 0.25 — Mild | |||
| 0.5 — Moderate | |||
| 0.75 — Severe | |||
| 1 — Extreme / Cannot do | |||
| Q2033 | Social activity | In the last 30 days, how much difficulty did you have in joining in community activities (for example, festivities, religious or other activities) in the same way as anyone else can? | 0 — None |
| 0.25 — Mild | |||
| 0.5 — Moderate | |||
| 0.75 — Severe | |||
| 1 — Extreme / Cannot do | |||
| Q2037 | Bathing | In the last 30 days, how much difficulty did you have in bathing / washing your whole body? | 0 — None |
| 0.25 — Mild | |||
| 0.5 — Moderate | |||
| 0.75 — Severe | |||
| 1 — Extreme / Cannot do | |||
| Q2038 | Getting dressed | In the last 30 days, how much difficulty did you have in getting dressed? | 0 — None |
| 0.25 — Mild | |||
| 0.5 — Moderate | |||
| 0.75 — Severe | |||
| 1 — Extreme / Cannot do | |||
| Q2039 | Everyday work | In the last 30 days, how much difficulty did you have in your day to day work? | 0 — None |
| 0.25 — Mild | |||
| 0.5 — Moderate | |||
| 0.75 — Severe | |||
| 1 — Extreme / Cannot do | |||
| Q2041 | Moving around the room | In the last 30 days, how much difficulty did you have with moving around inside your home (such as walking across a room)? | 0 — None |
| 0.25 — Mild | |||
| 0.5 — Moderate | |||
| 0.75 — Severe | |||
| 1 — Extreme / Cannot do | |||
| Q2042 | Eating | In the last 30 days, how much difficulty did you have with eating (including cutting up your food)? | 0 — None |
| 0.25 — Mild | |||
| 0.5 — Moderate | |||
| 0.75 — Severe | |||
| 1 — Extreme / Cannot do | |||
| Q2043 | Getting up from a lying position | In the last 30 days, how much difficulty did you have with getting up from lying down? | 0 — None |
| 0.25 — Mild | |||
| 0.5 — Moderate | |||
| 0.75 — Severe | |||
| 1 — Extreme / Cannot do | |||
| Q2044 | Toilet use | In the last 30 days, how much difficulty did you have with getting to and using the toilet? | 0 — None |
| 0.25 — Mild | |||
| 0.5 — Moderate | |||
| 0.75 — Severe | |||
| 1 — Extreme / Cannot do | |||
| Q2045 | Moving around the city | In the last 30 days, how much difficulty did you have with getting where you want to go, using private or public transport if needed? | 0 — None |
| 0.25 — Mild | |||
| 0.5 — Moderate | |||
| 0.75 — Severe | |||
| 1 — Extreme / Cannot do | |||
| BMI (1) | |||
| Q2506 | Height | Height | Measured height in centimeters |
| Q2507 | Weight | Weight | Measured weight in kilograms |
| Diagnosed diseases (9) | |||
| Q4001 | Arthritis | Have you ever been diagnosed with/told you have arthritis (a disease of the joints, or by other names rheumatism or osteoarthritis)? | 0 — No |
| 1 — Yes | |||
| Q4010 | Stroke | Have you ever been told by a health professional that you have had a stroke? | 0 — No |
| 1 — Yes | |||
| Q4014 | Angina pectoris | Have you ever been diagnosed with angina or angina pectoris (a heart disease)? | 0 — No |
| 1 — Yes | |||
| Q4022 | Diabetes | Have you ever been diagnosed with diabetes (high blood sugar)? | 0 — No |
| 1 — Yes | |||
| Q4025 | Lungs | Have you ever been diagnosed with chronic lung disease (emphysema, bronchitis, COPD)? | 0 — No |
| 1 — Yes | |||
| Q4033 | Asthma | Have you ever been diagnosed with asthma (an allergic respiratory disease)? | 0 — No |
| 1 — Yes | |||
| Q4040 | Depression | Have you ever been diagnosed with depression? | 0 — No |
| 1 — Yes | |||
| Q4060 | Hypertension | Have you ever been diagnosed with high blood pressure (hypertension)? | 0 — No |
| 1 — Yes | |||
| Q4062 | Cataract | In the last 5 years, were you diagnosed with a cataract in one or both of your eyes (a cloudiness in the lens of the eye)? | 0 — No |
| 1 — Yes | |||
| Dependent Variable — Life Satisfaction | |||
|---|---|---|---|
| (1) | (2) | (3) | |
| Description | OLS | Ordered logit | Ordered probit |
| Frailty | -2.118*** | -6.934*** | -3.844*** |
| (0.160) | (0.538) | (0.305) | |
| Frailty *50–59 | 0.109 | 0.169 | 0.031 |
| (0.267) | (0.873) | (0.477) | |
| Frailty * 75–89 | -0.488* | -1.490* | -0.844* |
| (0.262) | (0.902) | (0.478) | |
| Age group 50–59 | -0.048 | -0.125 | -0.053 |
| (0.046) | (0.179) | (0.097) | |
| Age group 75–89 | 0.180** | 0.595** | 0.329** |
| (0.072) | (0.286) | (0.151) | |
| Widow / Widower | -0.002 | -0.018 | -0.021 |
| (0.032) | (0.115) | (0.064) | |
| Unmarried or separated / divorced | -0.065* | -0.212 | -0.145* |
| (0.039) | (0.137) | (0.077) | |
| Number of family members | -0.004 | -0.021 | -0.008 |
| (0.008) | (0.030) | (0.016) | |
| Sex | -0.034 | -0.089 | -0.067 |
| (0.026) | (0.095) | (0.052) | |
| Place of residence | 0.061** | 0.186* | 0.110* |
| (0.031) | (0.109) | (0.060) | |
| Primary school or lower | -0.120** | -0.392** | -0.187* |
| (0.054) | (0.180) | (0.100) | |
| Secondary school | 0.030 | 0.115 | 0.073 |
| (0.035) | (0.119) | (0.067) | |
| Higher education | -0.048* | -0.142 | -0.080 |
| (0.029) | (0.109) | (0.059) | |
| Employment | -0.073** | -0.218* | -0.133** |
| (0.031) | (0.115) | (0.063) | |
| Financial position (2) | 0.312*** | 0.840*** | 0.502*** |
| (0.051) | (0.149) | (0.087) | |
| Financial position (2) | 0.382*** | 1.058*** | 0.623*** |
| (0.046) | (0.133) | (0.077) | |
| Financial position (4) | 0.638*** | 2.054*** | 1.183*** |
| (0.045) | (0.144) | (0.083) | |
| Financial position (5) | 0.745*** | 2.702*** | 1.509*** |
| (0.051) | (0.206) | (0.109) | |
| Quintile (2) | 0.007 | -0.014 | -0.009 |
| (0.042) | (0.143) | (0.079) | |
| Quintile (3) | 0.070 | 0.261* | 0.104 |
| (0.044) | (0.154) | (0.085) | |
| Quintile (4) | 0.078* | 0.218 | 0.118 |
| (0.042) | (0.147) | (0.081) | |
| Quintile (5) | 0.165*** | 0.605*** | 0.305*** |
| (0.042) | (0.156) | (0.086) | |
| Social life | 0.052 | 0.185 | 0.124 |
| (0.043) | (0.178) | (0.096) | |
| Socializing with friends | 0.094*** | 0.374*** | 0.189*** |
| (0.024) | (0.086) | (0.048) | |
| Caring for a relative | -0.098*** | -0.401*** | -0.208*** |
| (0.035) | (0.120) | (0.067) | |
| Threshold 1 | -5.512*** | -2.889*** | |
| (0.341) | (0.171) | ||
| Threshold 2 | -2.772*** | -1.558*** | |
| (0.259) | (0.139) | ||
| Threshold 3 | -0.141 | -0.085 | |
| (0.246) | (0.134) | ||
| Threshold 4 | 4.636*** | 2.542*** | |
| (0.280) | (0.151) | ||
| Constant | 3.412*** | ||
| (0.072) | |||
| Observations | 2,640 | 2,640 | 2,640 |
| R2 | 0.326 | ||
| Description | Variable names | LS = 1 | LS = 2 | LS = 3 | LS = 4 | LS = 5 |
|---|---|---|---|---|---|---|
| Frailty Index | FI | 0.056*** | 0.376*** | 0.774*** | -1.023*** | -0.184*** |
| (0.011) | (0.033) | (0.062) | (0.076) | (0.024) | ||
| Frailty * 50–59 | FI59 | -0.001 | -0.009 | -0.019 | 0.025 | 0.004 |
| (0.007) | (0.047) | (0.098) | (0.129) | (0.023) | ||
| Frailty * 75–89 | FI89 | 0.012 | 0.081* | 0.166* | -0.220* | -0.040 |
| (0.008) | (0.049) | (0.101) | (0.133) | (0.024) | ||
| Age group 50–59 | Group_59 | 0.001 | 0.007 | 0.014 | -0.018 | -0.003 |
| (0.002) | (0.010) | (0.020) | (0.026) | (0.005) | ||
| Age group 75–89 | Group_89 | -0.004** | -0.029** | -0.065** | 0.079** | 0.019* |
| (0.002) | (0.012) | (0.030) | (0.033) | (0.012) | ||
| Widow / Widower | Widowed | 0.000 | 0.001 | 0.002 | -0.003 | -0.000 |
| (0.001) | (0.006) | (0.013) | (0.017) | (0.003) | ||
| Unmarried or separated / divorced | Alone | 0.002 | 0.012 | 0.023 | -0.032 | -0.005 |
| (0.001) | (0.008) | (0.015) | (0.021) | (0.003) | ||
| Number of family members | Members | 0.000 | 0.001 | 0.002 | -0.003 | -0.001 |
| (0.000) | (0.002) | (0.003) | (0.004) | (0.001) | ||
| Sex | Sex | 0.001 | 0.005 | 0.010 | -0.013 | -0.002 |
| (0.001) | (0.005) | (0.010) | (0.014) | (0.003) | ||
| Place of residence | Setting | -0.002 | -0.010* | -0.021* | 0.028* | 0.005* |
| (0.001) | (0.006) | (0.012) | (0.017) | (0.003) | ||
| Primary school or lower | Primary | 0.004* | 0.023** | 0.043** | -0.061** | -0.009** |
| (0.002) | (0.012) | (0.019) | (0.029) | (0.004) | ||
| Secondary school | Secondary | -0.001 | -0.006 | -0.013 | 0.017 | 0.003 |
| (0.001) | (0.006) | (0.013) | (0.017) | (0.003) | ||
| Higher education | Graduate | 0.001 | 0.008 | 0.016 | -0.021 | -0.004 |
| (0.001) | (0.006) | (0.012) | (0.016) | (0.003) | ||
| Employment | Work | 0.002* | 0.012* | 0.024* | -0.032* | -0.006* |
| (0.001) | (0.007) | (0.012) | (0.017) | (0.003) | ||
| Financial position (2) | Finance (2) | -0.010*** | -0.070*** | -0.095*** | 0.168*** | 0.007*** |
| (0.003) | (0.013) | (0.017) | (0.029) | (0.002) | ||
| Financial position (3) | Finance (3) | -0.012*** | -0.083*** | -0.126*** | 0.211*** | 0.010*** |
| (0.003) | (0.013) | (0.015) | (0.026) | (0.002) | ||
| Financial position (4) | Finance (4) | -0.017*** | -0.124*** | -0.264*** | 0.372*** | 0.033*** |
| (0.004) | (0.013) | (0.017) | (0.027) | (0.004) | ||
| Financial position (5) | Finance (5) | -0.018*** | -0.138*** | -0.337*** | 0.428*** | 0.065*** |
| (0.004) | (0.013) | (0.022) | (0.027) | (0.011) | ||
| Quintile (2) | Quintile (2) | 0.000 | 0.001 | 0.002 | -0.002 | -0.000 |
| (0.001) | (0.009) | (0.016) | (0.023) | (0.003) | ||
| Quintile (3) | Quintile (3) | -0.002* | -0.015* | -0.030* | 0.041* | 0.006* |
| (0.001) | (0.009) | (0.018) | (0.024) | (0.004) | ||
| Quintile (4) | Quintile (4) | -0.002 | -0.013 | -0.025 | 0.034 | 0.005 |
| (0.001) | (0.009) | (0.017) | (0.023) | (0.003) | ||
| Quintile (5) | Quintile (5) | -0.004*** | -0.031*** | -0.070*** | 0.090*** | 0.016*** |
| (0.001) | (0.009) | (0.018) | (0.024) | (0.004) | ||
| Social life | Group | -0.001 | -0.010 | -0.021 | 0.027 | 0.005 |
| (0.001) | (0.009) | (0.020) | (0.025) | (0.005) | ||
| Socializing with friends | Friends | -0.003*** | -0.020*** | -0.043*** | 0.056*** | 0.010*** |
| (0.001) | (0.005) | (0.010) | (0.013) | (0.002) | ||
| Caring for a relative | Care | 0.004*** | 0.023*** | 0.044*** | -0.062*** | -0.009*** |
| (0.001) | (0.008) | (0.013) | (0.019) | (0.003) | ||
| Number of observations | Observations | 2,640 | 2,640 | 2,640 | 2,640 | 2,640 |
Information about the author
Victoria V. Fokina — Master Student at the Faculty of Economics, Lomonosov Moscow State University, Moscow, 119991, Russia. Email: viktoriaf2010@mail.ru