Data Paper |
|
Corresponding author: Dmitry Pomazkin ( dmitri.pomazkin@mail.ru ) © 2022 Dmitry Pomazkin, Vladimir Filippov.
This is an open access article distributed under the terms of the Creative Commons Attribution License (CC BY 4.0), which permits unrestricted use, distribution, and reproduction in any medium, provided the original author and source are credited.
Citation:
Pomazkin D, Filippov V (2022) Demographic resource for data analysis and visualization. Population and Economics 6(3): 117-124. https://doi.org/10.3897/popecon.6.e81027
|
Abstract
The demographic resource is designed to visualize demographic data in the Internet. The article provides a brief description of the database structure and examples of reporting forms. The following open sources of demographic information were used to develop the resource: the Human Mortality Database and Federal State Statistics Service. The use of the demographic resource provides access to basic demographic characteristics in the context of the Russian regions since 1990. In addition to Russia and its regions, this resource contains demographic information on a number of countries represented in The Human Mortality Database. The developed bilingual (Russian and English) interface enables forming both tabular and graphical reporting forms – demographic age-sex pyramids with one-year age groups, dynamic graphs and heatmaps of mortality rates. This demographic resource can be used for educational purposes, for developing analytical materials, reports and presentations. Data can also be uploaded in csv format for further analysis and use. The resource is available at: http://demography.infoarchives.ru
Keywords
Demographic databases, heatmaps of mortality rates, age-sex pyramids, visualization
Introduction
Analysis of a large amount of information is most effective when the selected information is presented in a compact and easy-to-process form. Demographic information often characterizes time-stretched processes and is presented in the form of time series. Graphical representation of time series greatly facilitates data visualization and analysis. In addition, one often needs to present several numerical series rather than only one, for comparative analysis or determination of additional characteristics, for instance, weighted average, etc. Similar problems arise in various fields where time series analysis is required (Karminsky, Pomazkin 1999; Karminsky, Pomazkin 2000;
The developed demographic resource provides for data uploading according to specified criteria, and developing both tabular and graphical reporting forms – demographic age-sex pyramids with one-year age groups, dynamic graphs, and heatmaps of mortality rates.
Similar solutions are provided by a number of web-based platforms, both specialized and those including demographic information:
- Demographic statistics for OECD countries (https://stats.oecd.org/), including population forecast by a 5-year group;
- open data of the World Bank (https://databank.worldbank.org/home.aspx);
- demographic databases on the website of the French Institute for Demographic Studies, combining various indicators in the field of demography (mortality, fertility, migration, etc.), as well as sociology, economics and politics. (https://datalab.site.ined.fr/en/demographic-contextual-data);
- World Factbook (https://www.cia.gov/the-world-factbook/countries).
Data sources and structure
The demographic resource presents annual data. Data on the Russian regions are provided by the Federal State Statistics Service (Rosstat), they are annually updated, usually in August of the following year. We did not adjust data by region based on censuses. The administrative-territorial division is not updated to the current state, previously existing subjects are included in the database.
Information on countries was obtained by exporting data posted on The Human Mortality Database (HMD) website www.mortality.org, and is annually updated, and there are also some data on countries not represented in the HMD database, obtained through individual projects (they are not updated). These countries include: Mexico, Saudi Arabia, Korea, Turkey and Uzbekistan. Information on these countries includes age and sex distribution and mortality tables in the structure used for HMD. Inclusion of these countries was aimed at preserving and providing access to additional information as well as demonstrating capabilities of the system to expand its functionality.
The data are stored in a relational database, which contains the following fields by one-year sex and age group:
- Year of observation,
- Age, years (from 0 to 110 years),
- Gender (male, female),
- Population, thousand people,
- Number of survivors up to the age of x (the root of the survival table is 100,000),
- Number of the deceased, people.
The Russian regional data are available since 1990 (Sevastopol since 2015), while data on countries are presented according to information available in the HMD database (for example, data on France are available since 1816).
Functional
The demographic resource consists of two main sections “Some countries of the World” and “Regions of Russia” with the following tabs:
- Population data
- Age structure
- Mortality heatmaps (only for Some countries of the World)
In «Population data» section it is possible to display and compare data from several countries or regions of the Russian Federation on the following indicators:
- Number of population, thousand people,
- Life expectancy at the age of x, years,
- Life expectancy of urban population at the age of x, years,
- Share of population at the selected age range, percentage,
- Population dependency ratio (ratio of the population aged over 60 years to the population aged 20-59 years),
- Number of the deceased, people.
The interface also contains filters for selecting data presentation period, age and gender of population group in question. Below are examples of sampling and visualization of data from «Population data» section (Fig.
«Age structure» section graphically displays a diagram of the population age-sex structure with a possibility to view changes by year. To do this, a slider is used, which interactively displays dynamics in changes in the age structure when moving. Figure
«Mortality heatmap» section displays a heatmap of mortality rates for the selected country over a specified period of time. Two-dimensional visualization clearly displays outbreaks of diseases, wars and other phenomena resulting in changes in mortality. Such data presentation makes it possible to evaluate changes in mortality rates over time and identify the most affected age groups. The observed relationship with historical events enables to conclude that the history is preserved in a new digital format, the carrier of which are mortality tables.
Using the heatmap settings one can adjust the noise level through changing amplitude of mortality rate by scaling parameters of the X and Y axes and RGB-colour channels.
Figure

Population of the Amur, Arkhangelsk and Nizhny Novgorod regions, 1990-2020, thousand people


Life expectancy at birth, Amur, Arkhangelsk, Moscow and Novgorod regions, 2008-2020, years

Age-sex structure of the UK population in 1982. Source: www.mortality.org

Method of constructing mortality heatmaps
Historical data on mortality indicate a strong dependence of the mortality rate on time rather than age alone. Therefore, analysis of changes in mortality is an important task.
Let’s consider a method that enables visualizing changes in mortality over time at each age. To do so, we compare the probability of death at each age during a given period of time.
The probability of dying at age (a) per year (t) is calculated as:
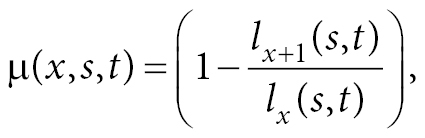
lx(s,t) is the number of persons of certain sex (s) who have lived to the age (x), according to the mortality table of the year (t).
The change in probability of death for the year is defined as follows:
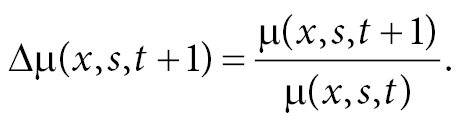
Next, projecting the resulting value, expressed as a percentage, onto the time-age plane, we get a heatmap for a certain gender. The vertical axis is the percentage of changes in probability of death.
Figure

Heatmap of annual changes in probability of death among Russian females, 1960-2006. Source: mortality tables for 1960-2007, HMD)
Such data presentation makes it possible to evaluate changes in death rates over time and identify the most affected age groups. Figure
Detailed results of such studies can be found in papers devoted to demographic history (Timofeev, Pomazkin).
Conclusion and prospects of the resource development
Readers have at their disposal a demographic resource for analyzing and visualizing data obtained from open sources of the Federal State Statistics Service and Human Mortality Database, enabling development of tabular and graphical reporting forms – demographic age-sex pyramids with one-year age groups, dynamic graphs and heatmaps of changes in mortality. The demographic resource has a bilingual user interface (Russian and English) and can be used for educational purposes, analytical material development, reports and presentations; in addition, the data are uploaded, if necessary, in csv format for further analysis and use.
In the near future, it is planned to automate data preparation and loading, adapt the application to mobile devices and expand functionality of data export.
Acknowledgements
The authors express their gratitude to Mrs. V.V. Potekhina, First Vice-President of JSC «Non-governmental pension fund GAZFOND» for her support and assistance to the study.
Reference list
- Chernavsky DS (2001) Sinergetika i informatsiya. Dinamicheskaya teoriya khaosa [Synergetics and information. Dynamic chaos theory]. Nauka, Moscow.
- Karminsky AM, Pomazkin DV (1999) Graficheskiy analiz dannykh v Internete [Graphical analysis of data on the Internet] // Bankovskiye tekhnologii [Banking Technologies] 2: 66-7.
- Karminsky AM, Pomazkin DV (2000) Obraznoye predstavleniye dannykh [Data metaphor] // Rynok tsennykh bumag [Stock Market] 4(163): 77-9.
- Kotlyarov OL, Pomazkin DV, Filippov VA (2014) Kontrolling v sfere IT [Controlling in IT]. In: SG Fal’ko (ed.) Modern enterprise and the future of Russia. Compendium of scientific papers of the international forum dedicated to the 85th anniversary of the Department «Economics and Organization of Production» of the Bauman Moscow State Technical University. Moscow, 130-5. URL: http://controlling.ru/files/65.pdf
Other sources of information
Federal State Statistics Service (Rosstat) https://rosstat.gov.ru /
Human Mortality Database. URL: www.mortality.org
Timofeev SA, Pomazkin DV Demograficheskaya istoriya [Demographic history]. URL: http://infoarchives.ru/old-site/data/di.pdf
Information about the authors
Dmitry V. Pomazkin, Candidate of Economic Sciences, JSC “Non-governmental pension fund GAZFOND”, Head of department. E-mail: D.Pomazkin@gazfond.ru
Vladimir A. Filippov, JSC “Non-governmental pension fund GAZFOND”, Head of department. E-mail: V.Filippov@gazfond.ru