Research Article |
|
Corresponding author: Marina G. Kolosnitsyna ( mkolosnitsyna@hse.ru ) © 2022 Marina G. Kolosnitsyna, Mikhail Yu. Chubarov.
This is an open access article distributed under the terms of the Creative Commons Attribution License (CC BY 4.0), which permits unrestricted use, distribution, and reproduction in any medium, provided the original author and source are credited.
Citation:
Kolosnitsyna MG, Chubarov MYu (2022) Spread of COVID-19 in the Russian regions in 2020: factors of excess mortality. Population and Economics 6(4): 1-20. https://doi.org/10.3897/popecon.6.e87739
|
Abstract
The paper identifies major factors associated with the pandemic spread in the Russian regions, using econometric models and nonlinear «Random Forest» models to assess their significance. The study is based on data of the Russian regions for March-December 2020, a balanced panel sample included 780 observations. Prevalence of the pandemic was estimated based on the excess mortality rate.
The study has identified a positive relationship between excess mortality and the share of migrants and a negative relationship between excess mortality and the share of pensioners in the region. Importance of climatic factors has been confirmed: high temperatures, other things being equal, reduce excess mortality, while high humidity, on the contrary, increases it. Excess mortality is higher in the regions with lower population mobility. Mortality is higher in the regions with high per capita incomes and regions with significant unemployment. Vice versa, excess mortality is lower in the regions with better doctor and nurse staffing levels.
The study results show that in case of repeated waves of the epidemic or emergence of new viruses, public health policy should be geographically differentiated. Priority should be given to epidemiological situation in the regions with humid climate and low temperatures, high incomes, intensive migration, and high unemployment rates. Significant investments in medical education, higher number of medical specialists and their more even distribution across regions are required. This approach turns out to be more effective in terms of reducing mortality rather than restrictions on population mobility.
Keywords
pandemic, self-isolation, age structure, migration, climate, income, unemployment, healthcare
Introduction
The coronavirus pandemic has been recognized by researchers and politicians as the most important challenge to health systems around the world since the famous «Spanish influenza» in 1918-1920. It had a significant impact on macroeconomic dynamics reducing the growth rate of gross domestic product (GDP), business and household incomes, as well as increasing unemployment in many countries. However, the COVID-19-associated consequences for modern societies should be assessed in terms of lost lives. According to Johns Hopkins Institute
In particular, this applies to papers on factors of morbidity or mortality from COVID-19. Early studies in 2020 were mainly based on small samples, used a descriptive approach or studied influence of a small number of factors, leaving aside other possible determinants. Authors of later papers, relying on a rather long series of monthly or daily data on countries or regions of one country, could use regression analysis and nonlinear machine learning models to receive more reliable findings. However, until now, numerous studies have received contradictory results regarding individual factors that affect (or do not affect) morbidity or mortality from COVID-19. Therefore, studying determinants of the pandemic’s spread is still relevant, especially in Russia, where only few studies using modern modeling techniques and data for a sufficiently long period have been published so far. The purpose of this study is to identify and evaluate relationship between individual factors and spread of the pandemic in the Russian regions in 2020.
1. What is behind the COVID-19 spread: overview of studies
Migration. The earliest studies conducted in spring, 2020, already showed that the epidemic was initially spreading across regions of individual countries from a large economic center. For example, in Italy, Milano was the epicenter of the infection, which is considered the country’s economic capital, and therefore, is the main direction of internal migration. Introduction of lockdown has initiated the process of reverse migration: people who came to Milano to work and study returned home. The majority of internal migrants come from the neighboring regions, and those becoming leaders in the number of COVID-10 cases after Lombardia (
Population density and urbanization. A distinctive feature of economic centers is high population density, which, according to conclusions of many studies, is positively associated with the spread of infection. Such results were obtained, in particular, in Brazil (
Population age structure. Since the beginning of the pandemic, the elderly has been declared the most vulnerable group. Indeed, in many countries there was a high mortality rate among the elderly associated, in particular, with concomitant diseases: diabetes, cardiovascular diseases, asthma, cancer, etc. (Singh et al. 2021). In some countries, high mortality rates were mainly due to institutionalization of the elderly, as, for example, in Italy, where infection occurred in nursing homes. In addition, researchers note the fact that older people are tested more often, and therefore the disease is detected more often, thus the registered incidence rate in this group may be overestimated (
Climatic factors can also influence spread of infections. Both individual countries and regions of large countries (including Russia) significantly differ in climatic characteristics. In literature a special attention is paid to temperature and relative humidity among all climatic factors, because they protect the human respiratory tract from infectious diseases (
Prevalence of urban vegetation is also an important environmental factor. Using the method of “path analysis”, it was proved that a 1% increase in green space in the city reduces spread of the coronavirus infection by 2.6%, other things being equal (
Political factors are numerous. First of all, these are the measures that governments are taking to curb spread of infection: from soft recommendations to complete lockdowns. The U.S. regional data show that actions aimed at reducing the COVID-19 spread are effective, both at the federal and regional levels (
Both rigidity of the measures taken and severity of the punishment for non-compliance play a significant role. Initially, it was assumed that the stricter the measures, the slower the spread. However, the example of Sweden, where maintaining of social distancing was only advisory in nature from the very beginning of the pandemic, showed that this is not necessarily the case (
A large-scale testing program is no less important: according to many researchers, countries that have initiated testing from the very beginning of the pandemic managed to better cope with the epidemic (
Directly or indirectly, economic factors influence the coronavirus infection spread. The more severe restrictive measures, the harder economic consequences for people, therefore, only a rather well-off population can afford to comply with self-isolation. In the U.S., a relatively high mobility was registered in poorer areas of the country. This is due to the fact that the poor population was forced, despite the lockdown, to go to work to cover their basic needs (
A study conducted in Mexico showed that the probability of dying from infection for the lower income decile population is 5 times higher compared to people from the upper decile (
A study conducted by
Finally, factors of the health system are of particular note. It is only logical to assume that better resource provision, including human, material, and financial, other things being equal, should at least reduce mortality, if not the disease incidence itself. However, in the first months of the pandemic, both morbidity and mortality grew at a catastrophic rate in rich countries with the developed and modern health systems. And vice versa, China, a relatively poor country with less medical resources, has quickly and effectively suppressed the first wave of the epidemic. This means that availability of medical services alone does not solve the problem if other necessary anti-infection policy measures are missing. Attempts to identify impact of health indicators on spread of the epidemic face an obvious challenge of endogeneity: increased disease incidence in many countries or regions made the authorities quickly respond to the deteriorated situation and expand capacity of medical institutions, increasing funding. Therefore, for example, such indicator as relative number of hospital beds increased following the increased number of patients. It is not surprising that in Italy, which was most affected at the beginning of the pandemic, a positive relationship between the number of hospital beds in provinces and both COVID-19 incidence and mortality was identified (
As review of studies shows, factors of the coronavirus infection spread are numerous and diverse in their effect, but in general they can be grouped into the following five main groups:
- demographic (population age composition, migration, population density, urbanization);
- environmental factors (temperature, humidity, urban greening);
- political factors (state actions – restrictive policy measures and degree of compliance with them, testing programs, subsequently – vaccination);
- economic factors (income level, poverty, inequality, housing conditions, employment specifics, unemployment);
- characteristics of the health system (availability of material and human resources, financing).
In this study, we will try to assess the relationship between all groups of factors and the coronavirus infection spread in the Russian regions in 2020 using econometric modeling and construction of nonlinear models.
2. Empirical analysis of factors of changes in excess mortality in the Russian regions during the pandemic
2.1 Data
The study uses data of the Federal State Statistics Service of the Russian Federation (Rosstat) (https://rosstat.gov.ru/). The sample included data on 82 regions of Russia, including the Tyumen and Arkhangelsk regions, without distinguishing districts. The observation period is limited to 10 months from March to December 2020, that is, from the beginning of the epidemic up to the initiation of mass vaccination in the country. In addition to Rosstat data, the study used information from Yandex’s public data visualization and analysis service, Yandex DataLens
2.2 Variables
The indicator of excess mortality per 100 000 population in the region – excess mortality – was used as a dependent variable in the construction of models. Following the majority of researchers, we have deliberately refrained from using the indicators of morbidity and/or mortality from COVID-19 provided by official statistics.
Already in early stages of the pandemic, experts pointed out obvious advantages of using excess mortality rate as the most objective indicator for comparisons (
There are different ways of evaluating excess mortality. This article used the following approach: first, the indicator of relative (per 100 000 population) mortality in each region was calculated for each month of each year – from 2017 to 2019. Then, for each region, a three-year average relative mortality for each month was calculated. Further, for each region, the average relative mortality in the same month in 2017-2019 was subtracted from the relative mortality for each month (from March to December) in 2020. Thus, we have obtained excess mortality for each region of Russia for every month in 2020:
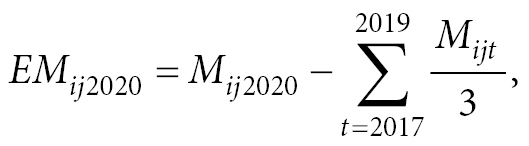 (1)
(1)
M – actual deaths;
EM – excess mortality;
i – region index;
j – month index;
t – year index, t = 2017-2019.
In some papers, only the previous year 2019 is used as a basis for comparison (
Independent variables for modeling were selected in accordance with the groups of morbidity and mortality factors identified above (Table
| Name | Description | Measurement and frequency of observations |
| Dependent variable | ||
| excess mortality | excess mortality | people, per 100 000 population of the region; monthly measurements |
| Independent variables | ||
| Demographic factors: | ||
| pensioners | share of pensioners | people per 100 000 population of the region; quarterly data |
| migrant | share of internal migrants | people per 100 000 population of the region; monthly data |
| capital | share of population residing in big cities | share of population living in the capital of the Russian subject and cities with population over 300 000 people, %; annual data |
| Environmental factors: | ||
| temp | average air temperature | ºС; monthly data |
| humidity | relative air humidity | %; monthly data |
| plants | urban greening | share of green spaces within the city limits per 1 hectare, %; annual data |
| Political factors: | ||
| self.isolation.aver | self-isolation index | from 1 to 5; monthly data |
| Economic factors: | ||
| income | per capita monetary income | in Russian rubles, in prices as of December, 2020; monthly data |
| flat | total residential premises per inhabitant | m2; annual data |
| unemployment | unemployment rate | share of the unemployed in the workforce, %; monthly data |
| Health system factors: | ||
| medicine | number of doctors and nurses | people, per 10 000 population; annual data |
The share of pensioners reflects, first, the age structure of the region, and second, what is important for this study, roughly shows the share of the non-employed elderly. Indicator of the number of pensioners per 100 000 population is available on a quarterly basis.
The number of internal migrants was calculated as the sum of the number of interregional and intraregional migrants, this indicator is available by month. Indicator of the share of population living in the capital of the subject of the Russian Federation and other cities with population over 300 000 people was manually calculated for each region as the sum of the number of all residents living in large cities of the region, attributed to the population of the region. This is an annual indicator.
To assess environmental factors, the following variables were used: average temperature and relative air humidity, and the share of green spaces within the city limits per 1 hectare. Data on average temperatures and humidity were taken for each region by month from WeatherArchive website. In winter months, the average temperature in most regions is below zero, therefore, to meet purposes of further logarithmation, the indicator had to be converted. A constant was added to each observation equal to the sum of the modulus of the highest negative value (-37.3 in December 2020 in the Republic of Sakha (Yakutia)) and figure of one. In order to obtain the share of green spaces within the city limits per 1 hectare, for each region, indicator of the total area of green spaces within the city limits was divided by the total area of urban land within the city limits.
Political factors are presented in the analysis as Yandex self-isolation index variable. Self-isolation of population is one of the major non-medical measures to control spread of the epidemic. In order to measure severity of the applied policy, researchers use various indicators. Some of them collect official data on all measures introduced or canceled and compile integral indexes for individual regions of the country or entire countries. This principle is used, in particular, to construct a well-known OxCGRT Severity Index (Oxford Coronavirus Government Response Tracker). Others use population geolocation indicators, which are usually collected by cameramen and other specialized companies, for example, Google Mobility in the U.S. or Baidu Maps in China (
Naturally, the Yandex index shows how the anti-infection measures are actually implemented rather than a formal set of anti-infection measures in effect in the region. In this sense, it can be considered as a proxy variable of the measures applied, adjusted for “compliance” of the population. At the same time, it is precisely this approach to taking into account policy measures that seems to be correct – after all, it is actual mobility that affects morbidity/mortality rather than decrees of the governor or resolutions of Rospotrebnadzor (Federal Service for the Oversight of Consumer Protection and Welfare). And vice versa, integral indices compiled on the basis of a set of measures taken require adjustments to the level of their implementation. The Yandex index has already been used in studies on prevalence of COVID-19 on the basis of the Russian data (
Yandex website only presents graphical distribution of the index by day and city, its quantitative values by region are not publicly available. To receive quantitative data, the authors requested the Research Department of Yandex LLC on an individual basis. Since this is a daily index, its monthly average for each month was calculated for each region.
Population per capita monetary income, total average area of residential premises per inhabitant, and unemployment among population aged 15 years and older were used as economic indicators. Monthly per capita monetary incomes were adjusted to constant prices in December 2020 using the basic consumer price index (CPI) for goods and services of the Federal State Statistics Service. Rosstat data on the total average area of residential premises per inhabitant of the region are available by month. Data on the unemployment rate among population aged 15 and older are available on a monthly basis.
Of all factors characterizing the health system, the study uses the number of doctors and nurses for one very important reason. The number of hospital beds, as well as expenditures of the healthcare system during the pandemic significantly increased, precisely as a response to the increased morbidity and mortality. Therefore, inclusion of these indicators in the model as independent variables does not seem well-grounded due to obvious endogeneity. Unlike beds and monetary expenses, it is impossible to increase the number of medical personnel in a short period of time, since medical professions require special and long-term education.
As outliers, we have removed data on Moscow, St. Petersburg and Sevastopol from the sample. The outliers are values of the indicator “the share of population living in the capital of the subject of the Russian Federation and other cities with population over 300 000 people” for Moscow, St. Petersburg and Sevastopol, because the indicator in the subject cities equals to 100%. In addition, the Chukotka District was excluded from the sample due to lack of data on the self-isolation index. In order to avoid duplication of information, data on autonomous districts within regions were not used. After removing the outliers, a balanced panel sample was obtained with a total of 780 observations in 78 regions over 10 months.
2.3 Descriptive analysis
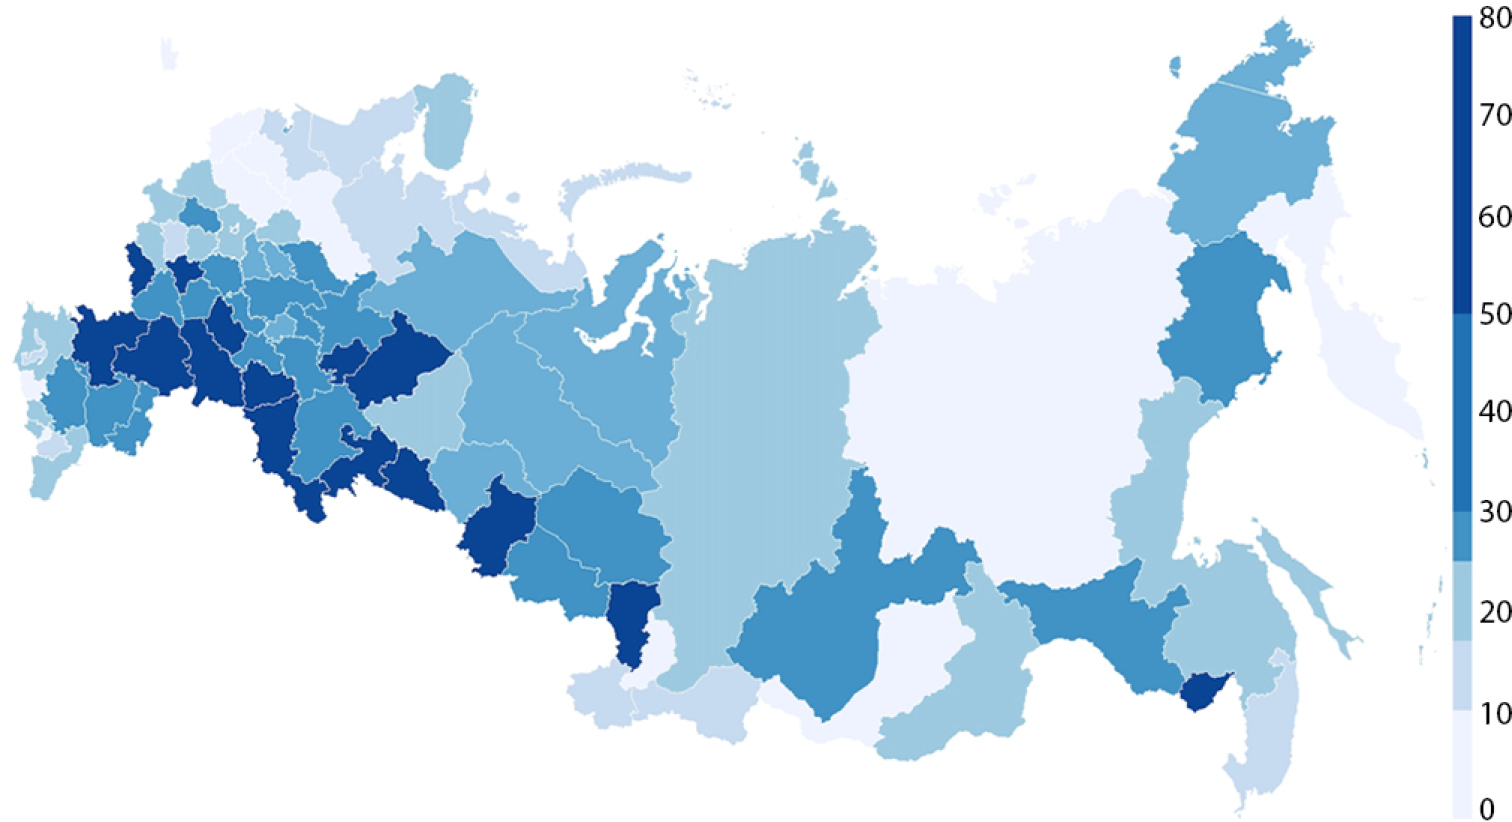
Distribution of excess mortality by region is shown on the map (Appendix). For visualization, we have selected October with one of the highest excess mortality rates. The value volatility of the dependent variable is high, excess mortality is unevenly distributed across the country. The leaders include the Krasnodar Krai, Volgograd, Saratov and Belgorod regions and some other regions. If we consider dynamics in the country’s average excess mortality by month (Figure
Dynamics in Yandex self-isolation index shows peak values across the country in April, which is quite expected, since it was April when the lockdown was in effect in most regions with the strictest restrictions on population movement (Figure
Table

Average excess mortality per 100 000 population in Russia by month, 2020. Source: authors’ calculations based on Rosstat data.

Average Yandex self-isolation index in Russia by month, 2020. Source: authors’ calculations based on Yandex DataLens data; URL: https://cloud .yandex.ru/services/datalens
| Measurement item | Average | Standard deviation | Mean | min | max | |
|---|---|---|---|---|---|---|
| excess.mortality | People per 100 000 population of the region | 20.35 | 26.83 | 13.16 | -30.42 | 125.64 |
| pensioners | People per 100 000 population of the region | 30 581 | 3 445 | 30 742 | 21 684 | 38 589 |
| migrants | People per 100 000 population of the region | 222.82 | 95.92 | 218.56 | 25.80 | 550.40 |
| capital | % | 38 | 11 | 38 | 5 | 66 |
| temp | ºС | 8.26 | 9.98 | 9.7 | -37.30 | 26.90 |
| humidity | % | 72 | 10 | 72 | 42 | 92 |
| plants | % | 22 | 11 | 20 | 2 | 55 |
| self.isolation.aver | - | 1.89 | 0.48 | 1.80 | 0.80 | 3.60 |
| income | in standard prices as of December, 2020, Russian rubles | 32 502 | 12 870 | 29 017 | 13 875 | 99 274 |
| flat | square meter | 27.20 | 3.96 | 27.56 | 14.29 | 34.18 |
| unemployment | % | 7.19 | 4.21 | 6.10 | 1.50 | 31.20 |
| medicine | People per 100 000 population of the region | 155 | 20.96 | 154 | 109 | 217 |
2.4 Hypotheses
Based on theoretical models of health economics and empirical studies conducted in other countries or earlier in Russia and with due regard to the pandemic complex nature and its both medical and social specific features, we expect that excess mortality will be associated with five groups of factors, namely: demographic characteristics of the region; peculiar features of the natural environment; restrictive policy in force in the region; and economic factors and state of the health system.
2.5 Modeling and results
The study used regression models of panel data as the main method. For the ease of result interpretation, a linear-logarithmic form of the model has been selected. Therefore, at the stage of data preparation, we have transformed variables of excess mortality and average temperature so that values of all observations became positive. The mortality function looks as follows (2):
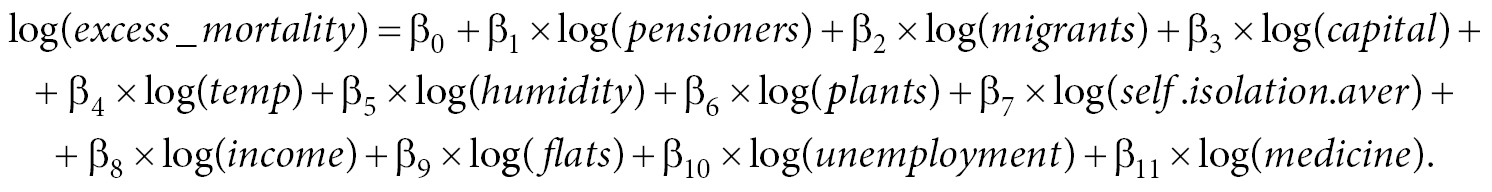
Three regression models have been evaluated: ordinarily least squares method (OLS or pooled regression), and fixed and random effect models (RE and FE). The models were evaluated using the R statistical package, version 4.0.2.
A consistent comparison of the estimated models using the Hausman specification test, Breusch–Pagan test and F-test suggests that a fixed effect model is more preferable. However, in this model we lose a number of important variables for which monthly values are not available. Due to peculiar features of the panel model with fixed effects, impact of all variables, which are annual, “goes” into effects of the regions. Therefore, we further interpret the coefficients of both the FE model and the OLS model, which turned out to be statistically significant.
As Table
To test results’ robustness of the linear econometric models, we have used the Random Forest model, a powerful algorithm based on the method of decision trees. It allows to establish nonlinear relationships between the selected variables. The models included the same factors that we used for regression models. At the first step, the sample was divided into a training and a test one in the proportion of 75:25. The number of trees was set to equal to 500. After testing the model on both samples, at the next stage, individual factors were checked for importance. The estimates obtained by the Random Forest method do not have an exact quantitative interpretation, like coefficients in linear regression models, but they make it possible to understand which factors are more important in the model. Figures
Using the “Random Forest” method, we proved that most of the factors that turned out to be significant in the regression panel model with fixed effects were also significant in the nonlinear model. Thus, the modeling results turned out to be quite sustainable.
| Veriable | OLS model | FE model |
| Pensioners | -0.01 | -36.81*** |
| (0.23) | (5.79) | |
| Migrants | 0.19*** | 0.43*** |
| (0.05) | (0.08) | |
| Capital | 0.08 | |
| (0.03) | ||
| Temp | -0.32*** | -0.16* |
| (0.07) | (0.07) | |
| Humidity | 0.98*** | 0.47* |
| (0.14) | (0.14) | |
| Plants | -0.07 | |
| (0.03) | ||
| Self.isolation.aver | 0.01 | 0.24*** |
| (0.05) | (0.06) | |
| Income | 0.31*** | 1.52*** |
| (0.08) | (0.20) | |
| Flat | 0.22† | |
| (0.18) | ||
| Unemployment | 0.18*** | 0.90*** |
| (0.06) | (0.14) | |
| Medicine | -0.48*** | |
| (0.18) | ||
| Constant | 2.56 | |
| (2.41) | ||
| R-squared | 0.25 | 0.54 |
| F-statistics | 22.90 | 114.74 |
| Number of observations | 780 | 780 |
| Number of objects of observation | 78 | 78 |

2.6 Discussion of the results
In general, the study hypotheses have been confirmed: in each of the five groups of the factors identified during literature review and descriptive data analysis, the modeling has identified variables that were statistically significantly associated with excess mortality rates.
Among demographic factors, a positive relationship between excess mortality and number of migrants has been confirmed, which is consistent with studies conducted both in Russia and other countries (
An interesting result is a relatively low excess mortality in regions with higher relative number of pensioners. It would seem that mortality among the elderly should be higher (Singh et al., 2021). However, people of this age group, first, do not work and objectively have fewer social contacts, and second, they are more careful and voluntarily comply with self-isolation requirements, even in the established restrictions are invalid (
The paper confirms significance of climatic factors: other things being equal, high temperatures reduce excess mortality, while high humidity, on the contrary, increases excess mortality. This conclusion confirms results of the study (
The self-isolation index turned out to be significantly and positively associated with excess mortality. This means that in those regions and in those months when the index is higher and mobility is lower, mortality rates are higher as well. Apparently, there is an inverse relationship out here: poor epidemiological situation makes people stay home regardless of formal restrictions, either because of illness and quarantine, or simply because of the fear of getting infected. This fact is consistent with conclusion of the study (Maloney and Taskin 2020). However, such conclusion obviously contradicts the claims about effectiveness of the compulsory large-scale isolation of population, which was used by authorities in many countries, including Russia, in the first months of the pandemic.
Among significant economic factors, per capita income especially noteworthy. Its positive association with excess mortality was confirmed by all models used in the work. It is natural that in richer regions with well-developed industry, transport and wholesale trade, the level of business activity is higher and more people continued to work even during the lockdown, therefore both morbidity and mortality were relatively higher. The obtained conclusion contradicts results of many foreign and one Russian work (
Another economic factor – unemployment –turned out to be positively associated with excess mortality as well. One can assume that people who lost their job due to closure of enterprises were made search for vacancies or part-time jobs and could not work on a remote basis. For the first time ever such conclusion was made based on the Russian data and does correspond to findings of studies conducted in other countries (
Finally, a negative relation between excess mortality in the region and number of medical specialists is another important result of the study. This conclusion is consistent with findings of many foreign studies (
Findings of this study may be used for developing public health policy in case of repeated waves of the epidemic or emergence of new viruses. Vast extent of the Russian territory and significant variation in climatic and socio-economic characteristics of its regions require differentiated policy measures, rather than its standardization. In particular, priority should be given to epidemiological situation in regions with humid climates and low temperatures, high incomes, intensive migration, and high unemployment – for example, in the framework of the next vaccination program. The COVID-19 pandemic has clearly demonstrated the need for significant investments in medical education to increase the number of medical specialists, which is extremely unevenly distributed across regions nowadays. This approach turns out to be more effective in terms of reducing mortality rather than restrictions on mobility.
2.7 Limitations of the analysis and prospects for further research
Limitations of the study are mainly related to shortcomings of information. Thus, individual statistical indicators are presented in Rosstat databases by region only on an annual or quarterly basis, significantly limiting capabilities of the analysis. Information on anti-infection policy measures implemented by regions is either unified nor systematized. There are no reliable data on the scale of population testing by region and in dynamics, making it impossible to include this important factor into modeling.
Furthermore, in this study, we have intentionally used information for 2020 only, when mass vaccination was yet to be initiated in the country. However, a further analysis, starting from 2021, does require inclusion of this factor. Meanwhile, there are no official data on the number of vaccinated by region and in dynamics yet. It is possible to use findings of sociological surveys of population and employers along with such data accumulation.
Acknowledgements
The authors would like to express their gratitude to employees of the Federal State Statistics Service and Research Department of Yandex, LLC, who have repeatedly answered individual requests during data collection for the analysis.
List of references
- Adolph C, Amano K, Bang-Jensen B, Fullman N, Wilkerson J (2021) Pandemic politics: Timing state-level social distancing responses to COVID-19. Journal of Health Politics, Policy and Law 46(2): 211–33. https://doi.org/10.1215/03616878-8802162
- Ahmadi M, Sharifi A, Dorosti S, Ghoushchi SJ, Ghanbari N (2020) Investigation of effective climatology parameters on COVID-19 outbreak in Iran. Science of the Total Environment 729: 138705. https://doi.org/10.1016/j.scitotenv.2020.138705
- Arceo-Gomez EO, Campos-Vazquez RM, Esquivel G, Alcaraz E, Martinez LA, Lopez NG (2022) The income gradient in COVID-19 mortality and hospitalisation: An observational study with social security administrative records in Mexico. The Lancet Regional Health – Americas 6: 100115. https://doi.org/10.1016/j.lana.2021.100115
- Brodeur A, Gray D, Islam A, Bhuiyan S (2021) A literature review of the economics of COVID-19. Journal of Economic Surveys 35: 1007–44. https://doi.org/10.1111/joes.12423
- Brotherhood L, Kircher P, Santos C, Tertilt M (2020) An economic model of the Covid-19 epidemic: The importance of testing and age-specific policies / CESifo Working Paper, No. 8316. Center for Economic Studies and Ifo Institute (CESifo), Munich [serial online]. URL: https://www.econstor.eu/handle/10419/219134
- Buja A, Paganini M, Fusinato R, Cozzolino C, Cocchio S, Scioni M, Rebba V, Baldo V, Boccuzzo G (2022) Health and healthcare variables associated with Italy’s excess mortality during the first wave of the COVID-19 pandemic: An ecological study. Health Policy 126(4): 294–301. https://doi.org/10.1016/j.healthpol.2022.03.002
- Chaudhry R, Dranitsaris G, Mubashir T, Bartoszko J, Riazi S (2020) A country level analysis measuring the impact of government actions, country preparedness and socioeconomic factors on COVID-19 mortality and related health outcomes. eClinicalMedicine 25: 100464. https://doi.org/10.1016/j.eclinm.2020.100464
- Cifuentes-Faura J (2021) Factors influencing the COVID-19 mortality rate in the European Union: importance of medical professionals. Public Health 200: 1–3. https://doi.org/10.1016/j.puhe.2021.09.003
- COVID-19 Excess Mortality Collaborators (2022) Estimating excess mortality due to the COVID-19 pandemic: a systematic analysis of COVID-19-related mortality, 2020–21. The Lancet 399(10334): 1513–36. https://doi.org/10.1016/S0140-6736(21)02796-3
- Danilova IA (2020) Morbidity and mortality from COVID-19. The problem of data comparability. Demographic review 7(1): 6–26. https://doi.org/10.17323/demreview.v7i1.10818 (in Russian)
- De Angelis E, Renzetti S, Volta M, Donato F, Calza S, Placidi D, Lucchini RG, Rota M (2021) COVID-19 incidence and mortality in Lombardy, Italy: An ecological study on the role of air pollution, meteorological factors, demographic and socioeconomic variables. Environmental Research 195: 110777. https://doi.org/10.1016/j.envres.2021.110777
- Dokhov R, Topnikov M (2021) Everyday mobility as a vulnerability marker: The uneven reaction to coronavirus lockdown in Russia. Environment and Planning A: Economy and Space 53(4): 612–15. https://doi.org/10.1177/0308518X20968564
- Druzhinin PV, Molchanova EV (2021) Mortality rates in Russian Regions in the context of the COVID-19 pandemic. Regionology = Russian Journal of Reional Studies 29(3): 666–85. https://doi.org/10.15507/2413-1407.116.029.202103.666-685 (in Russian)
- Egorov G, Enikolopov R., Makarin A., Petrova M. (2021) Divided we stay home: Social distancing and ethnic diversity // Journal of Public Economics 194: 104328. https://doi.org/10.1016/j.jpubeco.2020.104328
- Ettensperger F (2021) The Relationship Between Poverty and COVID-19 Infection and Case-Fatality Rates in Germany during the First Wave of the Pandemic. Statistics, Politics and Policy 12(2): 299–321 https://doi.org/10.1515/spp-2021-0002
- Glaeser EL, Gorback C, Redding SJ (2020) How much does COVID-19 increase with mobility? Evidence from New York and four other U.S. cities / NBER Working Paper No. 27519. https://www.nber.org/system/files/working_papers/w27519/w27519.pdf
- Goroshko NV, Patsala SV (2021) Main causes of excess mortality in Russia in the context of the COVID-19 pandemic. Social’nye aspekty zdorov’a naselenia / Social aspects of population health [serial online] 67(6): 1. https://doi.org/10.21045/2071-5021-2021-67-6-1 (in Russian)
- Hamidi S, Sabouri S, Ewing R (2020) Does density aggravate the COVID-19 pandemic? Early findings and lessons for planners. Journal of the American Planning Association 86(4): 495–509. https://doi.org/10.1080/01944363.2020.1777891
- Hartig T, Kahn PH (2016) Living in cities, naturally. Science 352(6288): 938–40. https://doi.org/10.1126/science.aaf3759
- Ivanov S (2020) Mortality from COVID-19 against the backdrop of other twentieth century mortality bursts. Demographic review 7(2): 143–51. https://doi.org/10.17323/demreview.v7i2.11141 (in Russian)
- Jarvis CI, Van Zandvoort K et al. (2020) Quantifying the impact of physical distance measures on the transmission of COVID-19 in the UK. BMC Medicine 18(1): 124. https://doi.org/10.1186/s12916-020-01597-8
- Kalinin AM, Zasimova LS, Kolosnitsyna MG, Khorkina NA (2020) Politika izolyatsii naseleniya vo vremya pandemii COVID-19: Kakiye strategii vygodny gosudarstvu? [Social Isolation Policy During COVID-19 Pandemic: What Strategies Are the Most Beneficial for the State?]. Public Administration Issues 4: 7-30. URL: Калинин%20и%20%др..pdf
- Khalatbari-Soltani S, Cumming RC, Delpierre C, Kelly-Irving M (2020) Importance of collecting data on socioeconomic determinants from the early stage of the COVID-19 outbreak onwards. Journal of Epidemiology & Community Health 74(8): 620–3. https://doi.org/10.1136/jech-2020-214297
- Kolosnitsyna MG, Chubarov MYu (2021) Socio-economic factors of mortality from infectious diseases in the Russian regions. Social’nye aspekty zdorov’a naselenia / Social aspects of population health [serial online] 67(5): 2. https://doi.org/10.21045/2071-5021-2021-67-5-2 (in Russian)
- Leon DA, Shkolnikov VM, Smeeth L, Magnus P, Pechholdová M, Jarvis CI (2020) COVID-19: a need for real-time monitoring of weekly excess deaths. The Lancet 395(10234). https://doi.org/10.1016/S0140-6736(20)30933-8
- Lewnard JA, Lo NC (2020) Scientific and ethical basis for social-distancing interventions against COVID-19. The Lancet. Infectious diseases 20(6): 631–3. https://doi.org/10.1016/S1473-3099(20)30190-0
- Lin J, Huang W et al. (2020) Containing the spread of coronavirus disease 2019 (COVID-19): Meteorological factors and control strategies. Science of the Total Environment 744: 140935. https://doi.org/10.1016/j.scitotenv.2020.140935
- Lowen AC, Steel J (2014) Roles of humidity and temperature in shaping influenza seasonality. Journal of virology 88(14): 7692–5. https://doi.org/10.1128/JVI.03544-13
- Mecenas P, Bastos RTdRM, Vallinoto ACR (2020) Effects of temperature and humidity on the spread of COVID-19: a systematic review. PLoS ONE 15(9): e0238339. https://doi.org/10.1371/journal.pone.0238339
- Mikhailova T, Valsecchi M (2020) Vnutrennyaya migratsiya i virus COVID-19 [Internal migration and the COVID-19 virus] / Ekonomicheskaya politika vo vremena COVID-19 [Economic policy during COVID-19]. Moscow: Russian School of economics. P.26-33. URL: https://www.nes.ru/files/COVID19(21apr2020).pdf (in Russian)
- Nakada LYK, Urban RC (2021) COVID-19 pandemic: environmental and social factors influencing the spread of SARS-CoV-2 in São Paulo, Brazil. Environmental Science and Pollution Research 28: 40322–8. https://doi.org/10.1007/s11356-020-10930-w
- Pascoal R, Rocha H (2022) Population density impact on COVID-19 mortality rate: A multifractal analysis using French data. Physica A: Statistical Mechanics and its Applications 593: 126979. https://doi.org/10.1016/j.physa.2022.126979
- Pilyasov AN, Zamyatina NYu, Kotov EA (2021) The spread of the Covid-19 pandemic in Russian regions in 2020: Models and reality. Ekonomika regiona [Economics of regions] 17(4): 1079–95. https://doi.org/10.17059/ekon.reg.2021-4-3 (in Russian)
- Pramanik M, Udmale P, Bisht P, Chowdhury K, Szabo S, Pal I (2022) Climatic factors influence the spread of COVID-19 in Russia. International journal of environmental health research 32(4): 723–37. https://doi.org/10.1080/09603123.2020.1793921
- Rachele JN, Kavanagh AM, Badland H, Giles-Corti B, Washington S, Turrell G (2015) Associations between individual socioeconomic position, neighbourhood disadvantage and transport mode: baseline results from the HABITAT multilevel study. Journal of Epidemiology & Community Health 69(12): 1217–23. URL: https://jech.bmj.com/content/69/12/1217
- Sabgayda TP (2021) The structure of excess mortality due to the novel coronavirus infection pandemic in urban and rural residents. Social’nye aspekty zdorov’a naselenia / Social aspects of population health [serial online] 67(5): 1. https://doi.org/10.21045/2071-5021-2021-67-5-1 (in Russian)
- Sabgayda TP, Zubko AV (2021) Do cold temperatures affect the spread of the new coronavirus infection? Social’nye aspekty zdorov’a naselenia / Social aspects of population health [serial online] 67(1):1. https://doi.org/10.21045/2071-5021-2021-67-1-1 (in Russian)
- Şahin M (2020) Impact of weather on COVID-19 pandemic in Turkey. Science of The Total Environment 728: 138810. https://doi.org/10.1016/j.scitotenv.2020.138810
- Stepanov VS (2020) Dependence between mortality in regions and prevalence of active SARS-CoV-2 carriers and resources available to public healthcare organizations. Health risk analysis 4: 12–22. https://doi.org/10.21668/health.risk/2020.4.02.eng (in Russian)
- Sun Y, Hu X, Xie J (2021) Spatial inequalities of COVID-19 mortality rate in relation to socioeconomic and environmental factors across England. Science of The Total Environment 758: 143595. https://doi.org/10.1016/j.scitotenv.2020.143595
- Wells CR, Townsend JP et al. (2021) Optimal COVID-19 quarantine and testing strategies. Nature communications 12(356). https://doi.org/10.1038/s41467-020-20742-8
- White ER, Hébert-Dufresne L (2020) State-level variation of initial COVID-19 dynamics in the United States. PLoS One 15(10): e0240648. https://doi.org/10.1371/journal.pone.0240648
- You Y, Pan S (2020) Urban vegetation slows down the spread of coronavirus disease (COVID‐19) in the United States. Geophysical Research Letters 47(18): e2020GL089286. https://doi.org/10.1029/2020GL089286
- Zemtsov SP, Baburin VL (2020) Coronovaris in the regions of Russia: features and consequences of the spread. Public Administration 2(124): 48–55. https://doi.org/10.22394/2070-8378-2020-22-2-48-55 (in Russian)
Other sources of information
Caul S (2020) Deaths involving COVID-19 by local area and socioeconomic deprivation: deaths occurring between 1 March and 31 July 2020. UK Office for National Statistics. URL: Deaths involving COVID-19 by local area and socioeconomic deprivation – Office for National Statistics (ons.gov.uk)
Maloney WF, Taskin T (2020) Determinants of social distancing and economic activity during COVID-19: A global view / The World Bank, Documents & Reports: No. WPS9242: 1–23. URL: https://documents.worldbank.org/en/publication/documents-reports/documentdetail/325021589288466494/determinants-of-social-distancing-and-economic-activity-during-covid-19-a-global-view
Appendix
Excess mortality by 100,000 of population, October 2020
Information about the authors
Marina G. Kolosnitsyna, Ph.D. (Econ.), professor, Department for Applied Economics, HSE University, Moscow, Russia. Email: mkolosnitsyna@hse.ru
Mikhail Yu. Chubarov, graduate student, junior research fellow, Faculty of economic science, HSE University, Moscow, Russia. Email: myuchubarov@edu.hse.ru