Research Article |
|
Corresponding author: Marina A. Kartseva ( mkartseva@mail.ru ) © 2022 Marina A. Kartseva, Polina O. Kuznetsova.
This is an open access article distributed under the terms of the Creative Commons Attribution License (CC BY 4.0), which permits unrestricted use, distribution, and reproduction in any medium, provided the original author and source are credited.
Citation:
Kartseva MA, Kuznetsova PO (2022) Short-term effects of the COVID-19 pandemic on employment and income of the Russian population: which groups were affected the most? Population and Economics 6(4): 21-42. https://doi.org/10.3897/popecon.6.e90410
|
Abstract
The paper analyzes short-term factors of job loss, wage reduction and factors of household income reduction in Russia in the context of the coronavirus crisis. Panel data of the Russian Longitudinal Monitoring Survey - Higher School of Economics (RLMS-HSE) served as empirical basis of the study.
According to the study results, the highest risks of job loss are registered among females, young employees, unskilled workers, workers without professional education, and workers with low wages. However, almost the only factor of wage reduction (in case of retained employment) is employment in the most affected industries. Household income prior to the pandemic is the key determinant of household income reduction – the higher the level of material wellbeing, the higher the risk of income reduction. Increased probability of income reduction is also reported for families with children.
The study has confirmed the hypothesis about negative impact of vulnerable employment on employment and wages of individuals, as well as household income.
Keywords
COVID-19, coronavirus, vulnerable employment, wages, household income, RLMS-HSE
Introduction
The COVID-19 pandemic has affected all spheres of people’s lives, slowed down the economic development, and aggravated social problems. Measures taken by governments to contain the disease spread (temporary closure of enterprises and organizations, restrictions on mobility, lockdowns, quarantine measures), served as an impetus to the onset of economic crisis comparable in scale to the crises caused by world wars (World Bank 2022). According to experts, as early as in 2020, the global economy experienced a 3% decline (IMF 2021).
The pandemic has made a dramatic impact on the labor market. According to the International Labor Organization, in 2020 compared to 2019, the total number of working hours in the world reduced by 8.8%, corresponding to the cut of 255 million full-time positions. Total earned income decreased by 8.3% during this period (ILO 2021). However, the impact of the crisis is uneven and significantly depends upon characteristics of the employment prior to the pandemic and socio-demographic characteristics of workers. In particular, workers employed in industries most affected by the epidemic, such as transport, construction, culture, leisure and entertainment, physical culture and sports, hospitality and tourism, catering, and household services turned out to be significantly more affected by the new coronavirus crisis (ILO 2021; Eurostat 2020;
A steady decline in female employment/earned income was a characteristic feature of the coronavirus crisis, although in case of a recession, it is usually males that are affected the most (ILO 2021; Eurostat 2020;
Deterioration of the labor market situation had a negative impact on the wellbeing of households - already in July 2020, 40% of households in high-income countries and 65%-70% of households in middle- and low-income countries experienced reduction in income (World Bank 2022). A study (
As in other countries, the COVID-19 pandemic in Russia has resulted in economic downturn. According to official statistics (Russian State Statistic Service (Rosstat) 2022) in 2020, Russia’s GDP decreased by 2.7%, while population’s real income - by 1.4% compared to 2019. The employment rate during this period decreased from 59.8% to 58.4% while the overall unemployment increased from 4.6% to 5.8%. At the same time, the actual average monthly wages of employees of organizations in 2020 increased by 3.8%. However, this indicator does provide for a full estimation of changes in the wage levels in the country, since it includes only employees of organizations and does not include information about those employed outside organizations (individual entrepreneurs, individuals, etc.). In addition, official statistics data do not allow us to analyze changes in employment and income of individual socio-demographic groups of population.
The literature devoted to assessing effects of the coronavirus pandemic on employment and income indicators in Russia is rather limited, which is largely due to lack of empirical data. The study (
The study (
This paper contributes to the study of short-term effects of the coronavirus pandemic on employment and income of the Russian population. The paper analyzes various socio-demographic and economic factors of the probability of job loss and reduction in earned income. The study also focuses on the risks of household income reduction. Additionally, the paper tests the assumption about negative impact of vulnerable employment on employment and income of the population during the new crisis type, made by the authors two years ago in the paper (Kartseva, Kuznetsova 2020). Vulnerable employment is determined with due regard to the following three main vectors according to which epidemiological restrictions can affect income of employees – self-employment/individual entrepreneurship, employment in the most affected industries and precarious employment. The study results can be used to develop social policy measures in the context of epidemiological crisis.
The article is structured as follows: section II describes in detail data that are the study empirical basis, and outlines basic principles of variable construction. Section III is devoted to the research methodology. Section IV discusses the study results. Section V presents main conclusions of the study.
2. Data and descriptive statistics. Variable construction
2.1 Data. Descriptive statistics
Panel data of the 28th and 29th rounds of the Russian Longitudinal Monitoring Survey - Higher School of Economics (RLMS-HSE) in 2019 and 2020 served as empirical basis of the study. The RLMS-HSE survey is an annual survey of the population conducted on the basis of a probability stratified multi-stage territorial sampling
When studying changes in employment characteristics, the main focus of the study is people of working age as of 2019 (females aged 18-54 and males aged 18-59). In order to assess the pandemic impact on employment, we have limited the sample to those individuals who had paid employment in the labor market in 2019. The sample included only those respondents whose information was present in the data for both 2019 and 2020. The total sample size of the study equaled to 5784 individuals. Tables
The paper has also analyzed changes in household income. In the course of the analysis, the RLMS-HSE data on households were combined with data on individuals, making it possible to combine information on household income and employment of household members. The study object in this case is a household. The sample selection criteria included availability of household income data in 2019 and 2020, as well as values of independent variables included in the regression analysis. The final sample size equaled to 6,198 households. Table
- A separate objective of the study is to test the hypothesis about the impact of vulnerable employment on the probability of deteriorated position of a person in the labor market and their reduced household income during the COVID-19 pandemic, made by the authors in their previous paper (Kartseva, Kuznetsova 2020). In the context of the pandemic, workers of the following three groups are considered vulnerable:
- self-employed and individual entrepreneurs;
- employees of non-governmental enterprises of the industries most affected by the pandemic (transport, culture, leisure and entertainment, physical culture and sports, hospitality and tourism, trade, catering, household services and education
2 ; - workers with precarious employment (Kartseva, Kuznetsova 2020). Precarious employment is determined according to the approach proposed in the papers (
Bobkov 2017 ;Bobkov et al. 2017 ). An employment is considered precarious if at least one of the following signs is present: low wages (less than the regional subsistence minimum); unofficial wages; work without official contract; salary delay; salary reduction, involuntary reduction of working hours; forced unpaid leave.
The study constructs an indicator of vulnerable employment, which takes the value 1 if the employee is attributed to at least one of the above groups and 0 – otherwise. In 2019, half of the employees (50.4%) had employment recognized as vulnerable (see Table. P2, Annex).
2.2 Job loss and wage reduction
Job loss
We believe that a person lost their job if in 2019 the respondent had a job, and in 2020 they are is unemployed (regardless of whether they became unemployed or left the workforce). According to calculations, 6.9% of people who had paid employment in 2019 lost their job in 2020. Relatively more often, women, young people (16-29 years old), people with lower education (general secondary education and lower), residents of metropolises and families with 3 or more children lost their job (see Table. P4, Annex). In the context of employment characteristics, workers in such industries as trade, household services, catering, hospitality and tourism, low-skilled workers, self-employed, and workers with low wages were relatively more likely to lose their job (see Table
Wage reduction
Analysis of changes in wages compared the 2019 employee’s salary with the one in 2020 (the analysis is carried out only for those employees who remained employed in 2020). To ensure regional comparisons, nominal wage indicators are adjusted to the cost of a fixed basket of consumer goods and services in the region. To ensure intertemporal comparisons, wages in 2020 are adjusted to the 2019 prices. The analysis does not include potential growth of wages that could have occurred without the pandemic.
58% of the employees experienced reduction in wage in 2020 compared to 2019. On average, wages were reduced by 16%. In order to exclude errors related to the wage measurement error, we use a 10% reduction in wage as a criterion for wage reduction. In other words, we believe that an employee’s salary has decreased if their salary in 2020 was 10% or more lower than in 2019
2.3 Household income. Descriptive statistics
The basis of the analysis of changes in household income in the context of the pandemic is the indicator of per capita household income, defined as the ratio between the total nominal household income and the number of its members. We compare per capita household income in 2019 and 2020. By analogy with wages, in order to ensure intertemporal and inter-regional comparisons, per capita incomes are adjusted to the cost of a fixed basket of consumer goods and services in the region and to the 2019 prices.
It should be noted here that specifics of income data collection under the Russian Longitudinal Monitoring Survey may influence assessment of the pandemic consequences. The fact is that within the framework of the Survey information about income is collected at the end of the year as of 30 days prior to the Survey. In this regard, comparing 2019 and 2020, we cannot take into account financial assistance that was provided in the midst of the pandemic and quarantine to various categories of households, including families with children. Thus, our comparisons are more focused on assessing longer-term consequences of the epidemiological crisis.
In general, according to the RLMS-HSE data, 53% of the households experienced per capita household income reduction in 2020 compared to 2019. The average reduction equaled to 20%. The paper has considered the following three variants of the per capita household income reduction indicator: a 10% and over reduction, 20% and over, and 30% and over reduction. An expanded range of income reduction indicators allows us to get an idea of sustainability of impacts of various factors, as well as how they are associated with weaker or, vice versa, stronger income shocks.
In 2020, 31% of the households faced a 10% and over reduction in income, income of 20% of the households was reduced by 20% and over, and 13% of the households experienced a 30% and over reduction in income (Table
During the COVID period families with high income were affected the most. We have considered quintiles of per capita household income in 2019 as income groups. It turned out that in 2020, about 17% of the poorest households and more than half of the households from the highest income group experienced a rather insignificant reduction in income - by 10% and over. A significant reduction in income is also much more often observed among households of the highest income quintile: about 30% of the households from the fifth group experienced a 30% and over reduction in per capita income over a year. For comparison: among households of the 1st and 2nd quintile, such a significant reduction in income is much less common, registered in 7-8% of cases. Therefore, income mainly decreased among those who had something to lose.
3. Methodology
To identify risk factors of job loss and wage reduction, as well as the risk of household income reduction, it is not enough to simply compare the average risk indicators by individual group. It is necessary to conduct an econometric analysis to determine significance of a particular factor, other characteristics of the individual or household being equal. Below is a summary of the models used in the study.
3.1 Risk of job loss
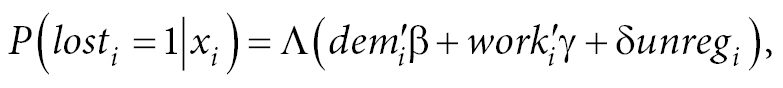
The study has undertaken an econometric analysis of socio-demographic and economic factors determining the probability of job loss in 2020. Let’s remember that the analysis is carried out for those individuals with paid employment in 2019. The following logit model has been evaluated (M1):
 (1)
(1)
losti is employment indicator of a person in 2020 (1 — employed, 0 — otherwise), demi is a vector of socio—demographic characteristics of an individual and their household that potentially affect their employment (including such indicators as gender and age of the agent, education, place of residence, marital status, paternal status with children of different ages), worki is a vector of indicators characterizing employment of a person in 2019 (including the employment type according to the Russian Classification of Occupations 010-2014), indicators of industry classification of employment, indicator of self-employment and low wages (below the regional subsistence level for the third quarter of 2019) and unregi is the 2020 regional unemployment rate. The regional unemployment rate is included in the set of explanatory variables in the analysis of employment characteristics as a factor characterizing local labor market strains, which significantly vary across the Russian regions.
To determine significance and magnitude of the vulnerable employment effect on the actual probability of job loss in the short term during the pandemic, the following logit model has been evaluated(M2):
 (2)
(2)
losti is employment indicator of a person in 2020 (1 — employed, 0 — otherwise), demi is a vector of socio—demographic characteristics of an individual and their household that potentially affect their employment (including such indicators as gender and age of the agent, education, place of residence, marital status, paternal status with children of different ages), vulempi is an indicator of vulnerable employment in 2019, and unregi is the 2020 regional unemployment rate. The model (2) does not include employment characteristics of an individual, since the vulnerable employment indicator is largely based on them.
3.2 Risk of wage reduction
For those people who remained employed in 2020, determinants of the probability of wage reductions has been evaluated. The study used logit models (M3 and M4) similar to those used to assess the risk of job loss:
 (3)
(3)
 (4)
(4)
wage_lossi is an indicator of a 10% and more reduction in wages in 2020 (compared to 2019), demi is a vector of socio-demographic characteristics of a person and their household, worki is a vector of employment indicators of a person in 2019) , vulempi — a vulnerable employment indicator in 2019, and unregi is the 2020 regional unemployment rate .
3.3 Risk of household income reduction
The study also used a regression logit model (M5) to assess factors influencing the risks of household income reduction:
 (5)
(5)
hhinc_lossi is the indicator of a 10%, 20% and 30% reduction in per capita household income in 2020 (compared to 2019), hhi is a vector of household characteristics in 2019, including the number of children under the age of 18, family members of retirement age, members with vulnerable employment, members with other employment, type of household place of residence, one of the five quintile income groups the household is affiliated with in 2019.
4. Results
4.1 Job loss
Table
The conducted econometric analysis shows statistically significant gender variation in the probability of job loss – the probability of becoming unemployed is 2 percentage points (p.p.) higher among females compared to males. Distribution by age shows that young people (aged 16 – 29) experience the highest risk of job loss. The risk of job loss is 3 p.p. higher among young employees compared to employees of the middle age. For the older age group (45 years and over), the probability of job loss does not statistically differ between older employees (45 and over) and employees of the middle age.
The study results failed to identify any significant impact of being married/having a partner on the risk of job loss. The presence of one or two children under the age of 18 is also insignificant in terms of the probability of job loss. However, if an employee has three or more children, then the probability of job loss is statistically significantly higher compared to the one without children. Further analysis showed that this effect is registered among females only –three and more children increase the probability of job loss by 3 p.p. (evaluation results of M1 and M2 models on subsamples of men and women are available upon request).
Education is the most important factor for maintaining employment during the pandemic. Employees without professional education were more likely to lose their job by 2-4 p.p. (depending on the model) compared to employees with higher education. A similar effect is registered among workers with basic vocational education (3 p.p.).
In the short term, the pandemic-related crisis has had a greater impact on the employment of residents of metropolises (Moscow, St. Petersburg). For employees living in Moscow and St. Petersburg, the risk of job loss is significantly higher on average compared to those living in regional centers. This is largely due to the employment structure of metropolises – there is a high share of services out there, which were affected the most during the pandemic. Employees in cities that are not regional centers, on the contrary, experienced a slightly lower risk of job loss, but this effect is statistically insignificant.
The employment characteristics prior to the pandemic have a significant impact on the probability of job loss during the crisis period. Those employed in trade, hospitality and tourism, household services, and catering had significantly higher risks of job loss. Unskilled and mid-skilled workers were more likely to lose their job compared to highly skilled workers (by 5 p.p. and 3 p.p, respectively). In addition, a higher risk of job loss was registered among self-employed and workers with low earned income.
The study has confirmed the hypothesis earlier made by the authors (Kartseva, Kuznetsova 2020) that vulnerable employment prior to the pandemic has a statistically significant negative impact on the probability of employment during the pandemic (M2 model). For an employee with vulnerable employment in 2019 the probability of job loss in 2020 is 5 p.p. and more higher compared to other employees.
Evaluation of the models of job loss and wage reduction factors, marginal effects
| Factors | Job loss | Wage reduction | ||
|---|---|---|---|---|
| М1 | М2 | М3 | М4 | |
| Social and demographic characteristics of respondent | ||||
| Gender (reference category – males) | ||||
| Female | 0.018** | 0.018** | -0.017 | -0.024 |
| [0.007] | [0.007] | [0.014] | [0.019] | |
| Age of the respondent (reference category – 30-44 years) | ||||
| 16 – 29 | 0.029*** | 0.028*** | -0.019 | -0.018 |
| [0.009] | [0.009] | [0.018] | [0.018] | |
| 45 – 54/59 (females/males) | 0.004 | 0.009 | -0.009 | -0.013 |
| [0.009] | [0.008] | [0.016] | [0.015] | |
| Education of the respondent (reference category – higher professional education) | ||||
| General secondary education and lower | 0.023** | 0.044*** | -0.019 | -0.031 |
| [0.011] | [0.010] | [0.023] | [0.021] | |
| Primary vocational edication | 0.009 | 0.027*** | -0.016 | -0.022 |
| [0.010] | [0.009] | [0.018] | [0.016] | |
| Secondary vocational education | -0.002 | 0.008 | -0.028* | -0.035* |
| [0.010] | [0.010] | [0.017] | [0.019] | |
| Place of residence of the respondent (reference category – regional centers) | ||||
| Moscow, St. Petersburg | 0.073*** | 0.071*** | 0.034 | 0.032 |
| [0.012] | [0.012] | [0.025] | [0.025] | |
| Other cities (not regional centers) | -0.016* | -0.012 | 0.036** | 0.028* |
| [0.009] | [0.009] | [0.015] | [0.015] | |
| Rural areas | -0.006 | 0.006 | -0.018 | -0.033* |
| [0.009] | [0.009] | [0.017] | [0.018] | |
| Marital status (reference category – not married/ not in a partnership) | ||||
| Married/in a partnership | -0.009 | -0.008 | -0.010 | -0.011 |
| [0.008] | [0.008] | [0.015] | [0.016] | |
| Number of children under the age of 18 (reference category – no children) | ||||
| 1 child | -0.005 | -0.006 | 0.011 | 0.013 |
| [0.009] | [0.008] | [0.015] | [0.015] | |
| 2 children | 0.003 | 0.005 | 0.005 | -0.009 |
| [0.010] | [0.010] | [0.018] | [0.018] | |
| 3 and more children | 0.023* | 0.022* | 0.004 | 0.003 |
| [0.013] | [0.013] | [0.029] | [0.028] | |
| Type of employment of the respondent | ||||
| Type of economic activity (reference category – manufacturing) | ||||
| Set of dummy variables | (+) trade, services | (+) construction; transport and communications; trade, services | ||
| Qualification (reference category – high skills (codes 1 – 3 under the Russian Classification of Occupations 010-2014)) | ||||
| Low-skilled | 0.046*** | -0.006 | ||
| (code 9 under Job classifier 010-2014) | [0.014] | [0.030] | ||
| Mid-skilled | 0.034*** | -0.013 | ||
| (codes 4 – 8 under Job classifier 010-2014) | [0.009] | [0.016] | ||
| Type of employment (reference category – employees) | ||||
| Self-employed, individual entrepreneurs | 0.035*** | 0.022 | ||
| [0.010] | [0.022] | |||
| Earned income | ||||
| Earned income below the regional subsistence minimum | 0.049*** | -0.199*** | ||
| [0.010] | [0.038] | |||
| Vulnerable employment | ||||
| Vulnerable employment | 0.052*** | 0.038*** | ||
| [0.007] | [0.067] | |||
| Regional characteristics of the labour market | ||||
| Unemployment rate | 0.010*** | 0.010*** | 0.000 | -0.000 |
| [0.002] | [0.002] | [0.005] | [0.005] | |
| Number of observations | 5535 | 5771 | 4960 | 4999 |
4.2 Wage reduction
Table
The analysis failed to identify any significant variation in the probability of wage reduction by gender and age. The risk of pay cuts during the pandemic hardly differs among workers with different levels of education. A slightly lower probability of wage reduction is registered among workers with secondary vocational education; however, this result is statistically insignificant. Being married/having a partner is not a significant factor in terms of the probability of wage reduction. In contrast to the risk of job loss, the probability of wage reduction is not statistically different among workers (both men and women) with and without children.
Compared to employees living in regional centers, workers from other cities (which are not regional centers) were more likely to experience wage reduction. On the contrary, wage reduction among those employed in rural areas, was less frequently reported.
Certain characteristics of employment prior to the pandemic significantly affect the risk of wage reduction. A relatively high probability of earned income reduction was registered among those employed in such industries as trade, hospitality and tourism, household services, catering, construction, transport and communications. Employees with low wages are significantly less likely to experience reduction in earned income compared to employees with higher earnings. The employment type and qualification of the employee have no statistically significant impact on the risk of wage reduction.
Vulnerable employment is the most important significant factor of earnings reduction. The probability of wage reduction among those with vulnerable employment prior to the pandemic is 4 p.p. higher compared to other workers.
4.3 Household income reduction
The paper has analyzed factors of household income reduction in 2020 compared to 2019. As a dependent variable, three indicators of per capita household income reduction have been considered (a 10%, 20%, and 30% reduction). The inclusion of several variants of the indicator in the analysis makes it possible to identify factors associated with both insignificant and more significant changes in income.
Table
Household income on the eve of the pandemic turned out to be the most important factor of income reduction in 2020. As it was already mentioned in the discussion of descriptive statistics (Section II and Table
Higher risks of income reduction are observed for households living in the metropolises (significant for small income shocks) and in rural areas. It should be particularly noted here that at the level of descriptive analysis, higher risks of income reduction in rural households were not identified: the share of those who faced income reduction is slightly lower compared to the sample average (see Table
The impact of the number of employed household members on the risks of income reduction during the pandemic depends upon the employment type. Thus, workers with vulnerable employment in the household significantly increase the risk of a 10% reduction in income. At the same time, other workers in the household (without vulnerable employment) significantly reduce the risks of income shock – by 2-3 p.p. for families with 1 non-vulnerable worker and by 4-5 p.p. for families with 2 or more members with non-vulnerable employment. It should be noted here that the latter fact, as in the case of the risk of income reduction among rural households, is not distinguishable when analyzing descriptive statistics (on average, 29% of the households in the sample and 32-34% of the households with vulnerable employment experienced a 10% or more reduction in income, see Table
Regression analysis of the factors of per capita household income reduction in 2020 compared to 2019, logit model, marginal effects
| Factors | Per capita income in 2020 reduced by: | ||
|---|---|---|---|
| 10% | 20% | 30% | |
| Number of children under the age of 18 in the household (reference category – no children) | |||
| 1 child | 0.066*** | 0.070*** | 0.041*** |
| [0.016] | [0.014] | [0.012] | |
| 2 children | 0.122*** | 0.081*** | 0.049*** |
| [0.021] | [0.019] | [0.017] | |
| 3 and more children | 0.220*** | 0.172*** | 0.137*** |
| [0.034] | [0.034] | [0.032] | |
| Number of pensioners in the household (reference category – no pensioners) | |||
| 1 pensioner | -0.031** | -0.025** | -0.023** |
| [0.014] | [0.012] | [0.010] | |
| 2 and more pensioners | -0.040** | -0.031** | -0.047*** |
| [0.017] | [0.015] | [0.012] | |
| Number of household members with vulnerable employment (reference category – no vulnerable employment) | |||
| 1 member | 0.052*** | 0.035*** | 0.016 |
| [0.014] | [0.012] | [0.010] | |
| 2 and more members | 0.044** | 0.014 | 0.001 |
| [0.019] | [0.016] | [0.013] | |
| Number of household members with other employment (reference category – no other employment) | |||
| 1 member | -0.028** | -0.035*** | -0.036*** |
| [0.013] | [0.011] | [0.010] | |
| 2 and more members | -0.048*** | -0.041*** | -0.044*** |
| [0.018] | [0.015] | [0.013] | |
| Type of place of residence (reference category – reginal centers) | |||
| Moscow and St. Petersburg | 0.040** | 0.005 | 0.004 |
| [0.019] | [0.016] | [0.013] | |
| Other cities | 0.019 | 0.008 | -0.003 |
| [0.013] | [0.012] | [0.010] | |
| Rural settlement | 0.079*** | 0.054*** | 0.033*** |
| [0.016] | [0.014] | [0.013] | |
| Quintile income group (reference category – 3rd group, mid-level income) | |||
| 1st group (the poorest) | -0.147*** | -0.066*** | -0.024** |
| [0.016] | [0.013] | [0.010] | |
| 2nd group | -0.057*** | -0.039*** | -0.017 |
| [0.017] | [0.014] | [0.011] | |
| 4th group | 0.118*** | 0.099*** | 0.062*** |
| [0.019] | [0.016] | [0.013] | |
| 5th group | 0.263*** | 0.280*** | 0.256*** |
| [0.019] | [0.018] | [0.017] | |
| Number of observations | 6198 | 6198 | 6198 |
5. Conclusions
The paper has undertaken an econometric study of the short-term effects of the epidemiological crisis on employment and income of the Russian population. In particular, factors deteriorating position in the labor market have been identified, namely, factors of job loss and wage reduction. It is shown that the highest probability of job loss in the first year of the pandemic was observed among young employees (aged 16-29), workers without professional education and workers with low wages, whose employment is traditionally considered precarious. Other things being equal, young and low-skilled workers have less specific human capital, and a company can easily dismiss such workers in crisis situations and easily hire them during the period of growth.
Like in other countries, in Russia, women lost their job more often than men during the pandemic. Women with three or more children experienced the highest risks of job loss. To a large extent, the observed gender variation of the effect is explained by the sharply increased demand for housework (child care, housekeeping) during the pandemic. Thus, socio-demographic characteristics of the employee are significant determinants of job loss during the coronavirus crisis. However, the study failed to identify any significant impact of socio-demographic characteristics on the probability of wage reduction among those who retained employment.
From the point of view of employment characteristics, high risks of job loss were registered among employees of the industries most affected by the coronavirus crisis. In addition, a significantly higher probability of job loss was registered among workers with low and mid-level skills, self-employed and individual entrepreneurs, as well as workers with low earned income. Employment in the industries most affected by the pandemic turned out to be almost the only significant risk factor for the probability of earned income reduction.
The analysis has confirmed the hypothesis earlier made by the authors (Kartseva, Kuznetsova 2020) about impact of the complex indicator of vulnerable employment on the probability of job loss/wage reduction. This indicator aggregates information about the three risks most relevant in the context of the pandemic – employment in the most affected industries, self-employment and precarious employment. According to the results obtained, vulnerable employment prior to the pandemic increases the probability of job loss during the pandemic by 5 p.p., and increases the probability of earned income reduction by 4 p.p.
It should be noted here that in terms of risk factors for workers in the labor market during the pandemic, Russia hardly differs from other countries. Numerous foreign studies identify almost the same groups of employees with increased risks of job loss /income reduction during the pandemic as in Russia – young employees, workers with low education/skills, women, parents with children, workers in the most affected industries (see, for example, ILO 2021;
Additionally, the study has analyzed factors of per capita household income reduction. The best predictor of the risk of income shock in 2020 was the household income a year earlier – the more well-off the family, the higher the risk of income reduction. For example, the probability of a 30% reduction in income among the poorest quintile households was 2 p.p. lower compared to the third (middle) income group household, and 26 p.p. higher for the highest income quintile households.
Despite unprecedented support measures aimed at sustaining income of families with children during the pandemic, families with children under the age of 18, all other things being equal, were more affected by income reduction. The study results confirm the estimates of future changes in income of families with children obtained by the study (
Members with vulnerable employment in the household significantly increase the risks of income reduction, while members with other employment in the household, on the contrary, significantly reduce them.
As for the positioning of the household income reduction factors identified by the authors in earlier studies, both similarities and certain differences can be noted. Similarities include significantly higher risks of income reduction among households with children (
The new results include the following: in 2020, households with higher income were affected the most. Studies based on data on other countries, show a different relationship: either higher risks for the poor (
An important limitation of this study is impossibility of analyzing changes in employment and income that occurred during the year between the two rounds of the survey. This limitation is due to the peculiarities of the RLMS-HSE data.
List of references
- Adams-Prassl A, Boneva T, Golin M, Rauh C (2020) Inequality in the impact of the coronavirus shock: Evidence from real time surveys. Journal of Public Economics 189: 104245. https://doi.org/10.1016/j.jpubeco.2020.104245
- Albanesi S, Kim J (2021) Effects of the COVID-19 recession on the US labor market: Occupation, family, and gender. Journal of Economic Perspectives 35(3): 3–24. https://doi.org/10.1257/jep.35.3.3
- Almeida V, Barrios S, Christl M, De Poli S, Tumino A, van der Wielen W (2021) The impact of COVID-19 on households´ income in the EU. The Journal of Economic Inequality 19(3): 413–31. https://doi.org/10.1007/s10888-021-09485-8
- Alon T, Doepke M, Olmstead-Rumsey J, Tertilt M (2020) The Impact of COVID-19 on Gender Equality. Covid Economics: Vetted and Real-Time Papers, Issue 4, London: CEPR Press.
- Alstadsæter A, Bratsberg B, Eielsen G, Kopczuk W, Markussen S, Raaum O, Røed K (2020) The first weeks of the coronavirus crisis: Who got hit, when and why? Evidence from Norway. NBER Working Papers 27131, National Bureau of Economic Research, Inc. https://doi.org/10.3386/w27131
- Aum S, Lee SY, Shin Y (2020) COVID-19 doesn’t need lockdowns to destroy jobs: The effect of local outbreaks in Korea. Labour Economics 70: 101993. https://doi.org/10.1016/j.labeco.2021.101993
- Béland L-P, Brodeur A, Wright T (2020) The Short-Term Economic Consequences of Covid-19: Exposure to Disease, Remote Work and Government Response. IZA Discussion Paper No. 13159. URL: https://ssrn.com/abstract=3584922
- Bobkov VN (2017) Precarious employment in the formal economy of Russia as the main reason for informal employment. Living standards of the population in the regions of Russia 13(1): 7-16. URL: https://www.jour.fnisc.ru/index.php/vcugjournal/article/view/8207 (in Russian)
- Bobkov VN, Kvachev VG, Loktyukhina NV, Ricceri M (2017) Criteria, probability and degree of instability of employment taking into account the features of the Russian labour market. Economy of Region 13(3): 672–83. https://doi.org/10.17059/2017-3-3 (in Russian)
- Bradley J, Ruggieri A, Spencer AH (2021) Twin Peaks: Covid-19 and the labor market. European Economic Review 138: 103828. https://doi.org/10.1016/j.euroecorev.2021.103828
- Bundervoet T, Dávalos ME, Garcia N (2021) The short-term impacts of COVID-19 on households in developing countries: An overview based on a harmonized dataset of high-frequency surveys. World Development 153: 105844. https://doi.org/10.1016/j.worlddev.2022.105844
- Christelis D, Georgarakos D, Jappelli T, Kenny G (2020) The Covid-19 crisis and consumption: Survey evidence from six EU countries. Working Paper Series No 2507. European Central Bank. http://dx.doi.org/10.2139/ssrn.3751097
- Couch KA, Fairlie RW, Xu H (2022) The evolving impacts of the COVID-19 pandemic on gender inequality in the US labor market: The COVID motherhood penalty. Economic Inquiry 60(2): 485–507. https://doi.org/10.1111/ecin.13054
- Dang H-AH, Nguyen CV (2021) Gender inequality during the COVID-19 pandemic: Income, expenditure, savings, and job loss. World Development 140: 105296. https://doi.org/10.1016/j.worlddev.2020.105296
- Gimpelson VE (2021) Wages and labor market flows in time of COVID. Working paper WP3/2021/10. National Research University Higher School of Economics. Moscow: HSE Publ. House. Series WP3 “Labour Markets in Transition”. URL: https://wp.hse.ru/data/2021/12/13/1776209980/WP3_2021_10_____.pdf (in Russian)
- Grishina EE (2021) Epidemiological crisis of 2020: financial situation of the population and social support. Population 24(1): 15–23. https://doi.org/10.19181/population.2021.24.1.2 (in Russian)
- Kansiime MK, Tambo JA, Mugambi I, Bundi M, Kara A, Owuor C (2021) COVID-19 implications on household income and food security in Kenya and Uganda: Findings from a rapid assessment. World Development 137: 105199. https://doi.org/10.1016/j.worlddev.2020.105199
- Kartseva MA, Kuznetsova PO (2020) The economic consequences of the coronavirus pandemic: which groups will suffer more in terms of loss of employment and income? Population and Economics 4(2): 26-33. https://doi.org/10.3897/popecon.4.e53194
- Long W, Zeng J, Sun T (2021) Who Lost Most Wages and Household Income during the COVID-19 Pandemic in Poor Rural China? China & World Economy 29(6): 95–116. https://doi.org/10.1111/cwe.12396
- Lopes AS, Carreira P (2022) COVID-19 impact on job losses in Portugal: who are the hardest-hit? International Journal of Manpower 43(5): 1265-82. https://doi.org/10.1108/IJM-06-2021-0384
- Mongey S, Pilossoph L, Weinberg A (2021) Which workers bear the burden of social distancing? Journal of Economic Inequality 19: 509–26. https://doi.org/10.1007/s10888-021-09487-6
- Morgan PJ, Trinh LQ (2021) Impacts of COVID-19 on Households in ASEAN Countries and Their Implications for Human Capital Development. ADBI Working Papers: 1226. Asian Development Bank Institute. URL: https://www.adb.org/sites/default/files/publication/688271/adbi-wp1226.pdf
- Pinkovetskaia I (2022) Impact of Covid-19 pandemic on household income: results of a survey of the economically active population. Studia Universitatis „Vasile Goldis” Arad – Economics Series 32(1): 43-57. URL: https://doi.org/10.2478/sues-2022-0003
- Pishnyak A, Gorina E, Korchagina I, Ter-Akopov S (2021) Financial well-being of the population in the pandemic: The impact of the income support policy response in Russia. Ekonomicheskaya Politika [Economic Policy] 16(6): 70–93. https://doi.org/10.18288/1994-5124-2021-6-70-93 (in Russian)
- Pouliakas K, Branka J (2020) EU jobs at highest risk of COVID-19 social distancing: will the pandemic exacerbate labour market divide? IZA Working Paper 13281. IZA – Institute for Labor Economics, Bonn. URL: https://www.iza.org/publications/dp/13281/eu-jobs-at-highest-risk-of-covid-19-social-distancing-will-the-pandemic-exacerbate-labour-market-divide
- Tikhonova NE (2021) Consequences of the 2020–2021 crisis for different professional groups in Russian society. Sociological Journal 27(2): 46–67. https://doi.org/10.19181/socjour.2021.27.2.8086 (in Russian)
- Vilar-Compte M, Hernández-F M, Gaitán-Rossi P, Pérez V, Teruel G (2022) Associations of the COVID-19 pandemic with social well-being indicators in Mexico. International Journal for Equity Health 21: 74. https://doi.org/10.1186/s12939-022-01658-9
- Webster A, Khorana S, Pastore F (2022) The labour market impact of COVID-19: early evidence for a sample of enterprises from Southern Europe. International Journal of Manpower 43(4): 1054–82. https://doi.org/10.1108/IJM-04-2021-0222
- Yasenov VI (2020) Who Can Work from Home? IZA Discussion Paper No. 13197. http://dx.doi.org/10.2139/ssrn.3590895
Other sources of information
Eurostat (2020) Impact of COVID-19 on employment income – advanced estimates https://ec.europa.eu/eurostat/statistics-explained/index.php?title=Impact_of_COVID-19_on_employment_income_-_advanced_estimates (дата обращения: 01.07. 2022)
ILO (International Labor Organization) (2021) ILO Monitor: COVID-19 and the world of work. 7th edition. https://www.ilo.org/global/topics/coronavirus/impacts-and-responses/WCMS_767028/lang--en/index.htm
IMF (International Monetary Fund) (2021) Recovery during a Pandemic: Health Concerns, Supply Disruptions, and Price Pressures. Washington, DC. https://www.imf.org/en/Publications/WEO/Issues/2021/10/12/world-economic-outlook-october-2021
Rosstat (2021) Russian statistical yearbook 2021. Statistical book. https://gks.ru/bgd/regl/b21_13/Main.htm (дата обращения: 01.07.2022)
Rosstat (2022) Regions of Russia. Socio-economic indicators – 2021. https://gks.ru/bgd/regl/b21_14p/Main.htm (дата обращения: 01.07.2022)
World Bank (2022) World Development Report 2022: Finance for an Equitable Recovery. Washington, DC: World Bank. https://openknowledge.worldbank.org/handle/10986/36883
Annex
Distribution of the respondents by major social and demographic group, 2019
| Group (as of 2019) | Share in sampling, % |
|---|---|
| Gender | |
| Females | 51.7 |
| Age | |
| 16-29 | 17.8 |
| 30-44 | 51.8 |
| 45+ | 30.4 |
| Education | |
| General secondary education or lower | 12.4 |
| Primary vocational education | 28.2 |
| Secondary vocational education | 23.2 |
| Higher professional education | 36.2 |
| Place of residence | |
| Metropolises (Moscow, St. Petersburg) | 10.6 |
| Regionalcenter | 34.5 |
| Other cities | 27.8 |
| Rural area, urban-type settlement | 27.1 |
| Marital status | |
| Married/in a partnership | 75.6 |
| Number of children under the age of 18 | |
| None | 40.2 |
| 1 child | 32.0 |
| 2 children | 21.3 |
| 3 and more children | 6.5 |
| Group (as of 2019) | Share in sampling, % |
| Type of economic activity | |
| Agriculture | 3.9 |
| Manufacturing | 16.7 |
| Construction | 7.7 |
| Transport and communications | 9.9 |
| Education, science, culture | 13.5 |
| Healthcare, social services | 7.5 |
| Finances, real estate, law | 4.2 |
| Public administration | 2.3 |
| Trade, household services, catering, hospitality and tourism | 24.3 |
| Housing and communal services | 3.7 |
| Other | 6.5 |
| Qualification | |
| Unskilled (code 9 under Russian Classification of Occupations 010-2014) | 6.6 |
| Mid-skilled (codes 4–8 under Russian Classification of Occupations 010-2014) | 49.0 |
| Highly skilled (codes 1–3 under Russian Classification of Occupations 010-2014) | 44.4 |
| Type of employment | |
| Self-employed, individual entrepreneurs | 9.5 |
| Earned income | |
| Below the regional subsistence level | 8.1 |
| Vulnerable employment | |
| Employment is vulnerable | 50.4 |
Distribution of the households by major social and demographic characteristic
| Group (as of 2019) | Share in sampling, % |
| Number of children under the age of 18 | |
| None | 64 |
| 1 child | 19.7 |
| 2 children | 0 |
| 3 and more children | 12.2 |
| Number of pensioners | |
| None | 46 |
| 1 pensioner | 36.4 |
| 2 and more pensioners | 17.6 |
| Place of residence | |
| Metropolises (Moscow, St. Petersburg) | 1.8 |
| Regional center | 32 |
| Other cities | 33.1 |
| Rural area, urban-type settlement | 23 |
| Number of household members with vulnerable employment | |
| None | 58.5 |
| 1 member with vulnerable employment | 29.7 |
| 2 and more members with vulnerable employment | 118 |
| Number of household members with other employment | |
| None | 56.1 |
| 1 member with other employment | 30.8 |
| 2 and more members with other employment | 13.1 |
| Income group | |
| 1st (low income) | 20 |
| 2nd | 19.6 |
| 3rd | 19.6 |
| 4-h | 19.8 |
| 5th (high income) | 21 |
Share of those who lost their job and share of those experienced wage reductions in 2020 compared to 2019 by main social and demographic group
| Group (as of 2019) | Lost their job, % | 10% and over wage reduction, % |
|---|---|---|
| All employees | 6.9 | 24.8 |
| Gender | ||
| Males | 6.2 | 26.4 |
| Females | 7.7 | 23.3 |
| Age | ||
| 16-29 | 9.9 | 23.8 |
| 30-44 | 6.1 | 25.9 |
| 45+ | 6.5 | 23.6 |
| Education | ||
| General secondary education or lower | 11.9 | 24.1 |
| Primary vocational education | 7.8 | 25.0 |
| Secondary vocational education | 6.0 | 22.7 |
| Higher professional education | 5.1 | 26.4 |
| Place of residence | ||
| Metropolises (Moscow, St. Petersburg) | 11.9 | 28.3 |
| Regional center | 6.5 | 24.9 |
| Other cities | 4.9 | 27.3 |
| Rural area, urban-type settlement | 7.5 | 20.9 |
| Marital status | ||
| Married/in a partnership | 6.4 | 24.8 |
| Number of children under the age of 18 | ||
| None | 7.3 | 24.1 |
| 1 child | 6.1 | 25.7 |
| 2 children | 6.5 | 25.4 |
| 3 and more children | 10.1 | 24.0 |
Share of those who lost their job and share of those experienced wage reductions by employment characteristic prior to the pandemic compared to 2019
| Group (as of 2019) | Lost their job, % | 10% of more wage reduction, % |
|---|---|---|
| All employees | 6.9 | 24.8 |
| Type of economic activity | ||
| Agriculture | 8.1 | 24.9 |
| Manufacturing | 5.7 | 22.8 |
| Construction | 7.7 | 31.9 |
| Transport and communication | 5.8 | 27.4 |
| Education, science, culture | 5.5 | 21.2 |
| Healthcare, social services | 4.4 | 20.8 |
| Finances, real estate, law | 5.5 | 27.3 |
| Public administration | 5.3 | 16.1 |
| Trade, household services, catering, hospitality and tourism | 9.7 | 28.0 |
| Housing and communal services | 8.6 | 19.1 |
| Other | 5.9 | 25.6 |
| Qualification | ||
| Unskilled (code 9 under Russian Classification of Occupations 010-2014) | 12.4 | 22.1 |
| Mid-skilled (codes 4–8 under Russian Classification of Occupations 010-2014) | 8.3 | 24.9 |
| Highly skilled (codes 1–3 under Russian Classification of Occupations 010-2014) | 4.5 | 25.1 |
| Type of employment | ||
| Self-employed, individual entrepreneurs | 12.6 | 27.8 |
| Earned income | ||
| Below the regional subsistence level | 15.3 | 9.6 |
| Vulnerable employment | ||
| Employment is vulnerable | 9.6 | 26.8 |
Share of the households experienced wage reduction by social and demographic characteristic
| Per capita income reduced by: | |||
|---|---|---|---|
| Group (as of 2019) | 10% | 20% | 30% |
| All people | 30.9 | 19.9 | 13.2 |
| Number of children under the age of 18 | |||
| None | 29.6 | 19.0 | 12.9 |
| 1 child | 32.8 | 22.8 | 14.5 |
| 2 children | 32.1 | 18.7 | 11.6 |
| 3 more children | 36.5 | 23.3 | 16.9 |
| Number of pensioners | |||
| None | 34.6 | 23.0 | 15.9 |
| 1 pensioner | 28.1 | 17.6 | 11.9 |
| 2 and more pensioners | 26.1 | 15.9 | 8.7 |
| Place of residence | |||
| Metropolises (Moscow, St. Petersburg) | 34.5 | 21.1 | 15.0 |
| Regional center | 31.6 | 21.3 | 14.7 |
| Other cities | 29.4 | 18.7 | 11.8 |
| Rural area, urban-type settlement | 29.9 | 19.0 | 12.3 |
| Number of household members with vulnerable employment | |||
| None | 26.8 | 16.9 | 11.2 |
| 1 | 36.1 | 24.0 | 16.0 |
| 2 and more | 37.9 | 24.4 | 16.4 |
| Number of household members with other employment | |||
| None | 28.9 | 18,6 | 12.7 |
| 1 | 33.8 | 21.6 | 14.0 |
| 2 and more | 32.3 | 21.3 | 13.3 |
| Income group | |||
| 1st (low income) | 16.5 | 10.7 | 7.5 |
| 2nd | 22.5 | 11.4 | 6.5 |
| 3rd | 26.6 | 14.3 | 7.6 |
| 4th | 36.7 | 22.6 | 12.8 |
| 5th (high income) | 50.7 | 39.3 | 30.6 |
Information about authors
Marina A. Kartseva, Candidate of Economic Sciences, Senior Researcher, Institute for Social Analysis and Forecasting under the Russian Presidential Academy of National Economy and Public Administration, Moscow, Russia, 119571. E-mail: mkartseva@mail.ru
Polina O. Kuznetsova, Candidate of Economic Sciences Senior Researcher, Institute for Social Analysis and Forecasting under the Russian Presidential Academy of National Economy and Public Administration. Moscow, Russia, 119571. E-mail: polina.kuznetsova29@gmail.com
Acknowledgements
The article was written on the basis of the RANEPA state assignment research programme.