Research Article |
|
Corresponding author: Stanislav V. Spektor ( spektorstas@gmail.com ) © 2023 Stanislav V. Spektor, Karina A. Ionkina.
This is an open access article distributed under the terms of the Creative Commons Attribution License (CC BY 4.0), which permits unrestricted use, distribution, and reproduction in any medium, provided the original author and source are credited.
Citation:
Spektor SV, Ionkina KA (2023) Estimating the effects of legalizing drug e-commerce. Population and Economics 7(1): 90-115. https://doi.org/10.3897/popecon.7.e96523
|
Abstract1
With the technological development the e-commerce channel began to spread to all sectors of the economy. In 2020 with the introduction of sanitary and epidemiological restrictions because of COVID-19 pandemic, many countries lifted the ban of drug e-commerce. Such changes are interesting from the point of view of health economics, and the opening of this sales channel significantly reduces transaction costs and increases the physical availability of drugs, especially in regions with low population density. The article attempts to evaluate the effects of legalization of online sales of drugs on price level and the degree of market concentration (the concentration of the 5 largest companies is used as a proxy), and also uses new methods to estimate the effects of legalizing e-commerce on drug markets. High rates of industry and drug market concentration can lead to a noticeable decrease in the availability of goods. Legalizing e-commerce can be seen as a way to reduce market concentration by facilitating market entry for small firms. The effects of lifting the ban on remote drug sales are estimated using regression analysis on panel data, cross-country matching, and synthetic control. Empirical estimates provide an overall picture of the effects of legalizing online drug sales. After allowing remote drug sales market concentration decreases, indicating a reduction in information asymmetry and switching costs. This effect is particularly important for countries with a high proportion of pensioners, for whom the switching costs are noticeably higher ceteris paribus. Allowing distance trade, due to reducing information asymmetry, drug pricing also slows down, that is, in addition to increasing physical accessibility, opening this channel also increases economic accessibility.
Keywords
drug e-commerce, competition, concentration, pricing, pensioners, panel data, synthetic control
Introduction
E-commerce in general is an important trade channel, crucial to population. Drug e-commerce is no exception and is playing more significant role in health economy. Firstly, it performs informational role, decreasing information asymmetry. With online pharmacies, buyers get easier access to information about drugs and their prices, can compare different medicines and their cost in different places, which in turn allows the population to purchase more suitable goods at a lower price. Secondly, drug e-commerce decreases transaction costs for the purchase of goods (primarily time and transport), which is especially important for remote communities which often do not have the necessary medicines readily available. However, e-commerce can also be associated with negative externalities, primarily in selling of substandard and counterfeit drugs to the buyer. It is possible to control traditional pharmacies at a lower cost, while opening a traditional pharmacy for an unscrupulous seller, on the contrary, is more difficult because of the high requirements for staff, space and storage of goods. Since the legalization of online drug sales can be associated with a number of negative effects, it is important to study possibilities of their occurrence. Global experience shows that in recent decades many countries have lifted bans on drug e-commerce (Fig.

Country policies regarding online drug sales in 2007 and 2021. Source: made by the authors based on the analysis of international experience.
The e-commerce market for drugs was growing rapidly before the pandemic, at about 20% per year, with a growth rate of 32,4% (Statista, 2022). The largest markets are China (the online commerce market is $17 billion, according to Euromonitor), the United States ($13.5 billion), Japan ($2.1 billion), Germany, and the United Kingdom ($1.9 billion each). In all these countries online trade of drugs has been allowed for several decades and the market is developed on par with offline trade and occupies a significant share in population purchases. For example, 22.2% of all OTC (over the counter) drugs in Germany are bought online, in China – 12.4%, in UK – 10.6%, in the USA – 4.3%, in Japan – 3%. In Russia, the market volume, according to Euromonitor
This article aims to estimate the effects of lifting the ban on remote sale of OTC and prescription drugs, including the effect on the prices level and the state of competition.
Current studies in legalizing of e-commerce in medicine
The development of e-commerce is influenced by many different factors, many of which are hard to track. Nevertheless, such factors as the use of computers and smartphones by households, the level of trust in online stores, GRP (gross regional product), GNI (gross national income), retail trade turnover have a significant quantitative impact on the involvement of regions in e-commerce (Lola & Bakeev 2021), as well as on R&D spending (Lucero Ortiz et al. 2020).
The drug market has its own specifics. Despite high demand for goods, entering the market for offline pharmacies in rural areas is difficult. Due to highly differentiated demand pharmacies incur high costs for purchasing all necessary pharmaceuticals (
Hypothesis 1: The concentration of producers is positively related to the share of pensioners in the country’s population and e-commerce channel decreases market concentration ceteris paribus.
The main drug market types are oligopoly (Craig & Malek 1995) and monopolistic competition (
For the drug market antimonopoly policy is extremely important since a cartel can become one of the triggers for a situation where vital medicines would not be available to the consumer. In the drug market, a manufacturer can have high market power even though market concentration is relatively low, as dominance can arise due to high switching costs for the buyer (Shastitko & Pavlova 2017), which applies for the drug market, where market power, where personal experience is one of leading factors in drug purchases (
The advent of e-commerce should reduce information asymmetry. The development of this channel lowers transaction costs of finding a product (
Speaking about negative externalities, online pharmacies can be represented by two types of sellers: high and low type, conscientious and unscrupulous. According to
Hypothesis 2: Remote trade of medicines reduces the price level in both the short and long term.
As the e-commerce market develops, the overall price level decreases, and the greater the decrease, the greater the competition in the market (
Data and methods
To test the hypotheses, we collected data from Euromonitor International (
Data on the market share of producers and brands were transformed into statistical indicators: concentration indices on 15, 10 and 5 biggest companies, Herfindahl-Hirschman Index (HHI), used to measure industry concentration. HHI values, though, can distort information about competition between producers and competition in markets: the index will be higher if the structure of the industry has a large asymmetry
In general, according to descriptive statistics, countries that have long adopted e-commerce in medicines, countries that have lifted the ban relatively recently and countries that have not lifted it, differ in their characteristics. According to the descriptive statistics presented in Table
Comparing the data before and after the ban lift the effects are uncertain, for example, price dynamics did not change after the ban lift (Fig.
According to correlation matrix (Fig.
| Ban lifted before 2006 | Ban was not lifted | Ban lifted after 2006 | |||||||
| mean | se | n | mean | se | n | mean | se | n | |
| GDP per capita | 43,191.2 | 5,875.29 | 16 | 5,350.71 | 1,064.61 | 33 | 21,890.04 | 2,744.48 | 51 |
| Internet user share | 85.48 | 2.61 | 13 | 56.06 | 4.47 | 25 | 76.48 | 2.68 | 49 |
| Price index | 1.02 | 0.01 | 10 | 1.07 | 0.04 | 17 | 1.04 | 0.01 | 26 |
| Urban population | 76.67 | 2.91 | 16 | 54.47 | 3.61 | 33 | 73.47 | 2.32 | 51 |
| Brand HHI | 56.89 | 12.48 | 14 | 122.35 | 16.04 | 34 | 107.47 | 15.95 | 51 |
| Brand number | 88 | 5.97 | 14 | 38.35 | 5.13 | 34 | 76.06 | 4.22 | 51 |
| Brand CR5 | 11.91 | 1.10 | 14 | 17.86 | 1.45 | 34 | 16.31 | 1.10 | 51 |
| Producer HHI | 713.91 | 90.33 | 14 | 555.52 | 66.83 | 34 | 562.82 | 44.34 | 51 |
| Producer number | 65.71 | 4.08 | 14 | 37.29 | 4.12 | 34 | 61.98 | 2.98 | 51 |
| Producer CR5 | 49.35 | 3.69 | 14 | 40.98 | 2.37 | 34 | 41.90 | 1.62 | 51 |
| Health expenditure | 10.25 | 0.75 | 12 | 5.47 | 0.36 | 33 | 6.75 | 0.33 | 50 |
| Pensioner share | 19.43 | 1.03 | 12 | 6.86 | 0.88 | 33 | 12.64 | 0.90 | 51 |
| Life Expectancy | 81.89 | 0.47 | 12 | 71.59 | 1.19 | 34 | 77.16 | 0.62 | 51 |

Price index for medicines in countries where distance selling of medicines was legalized in 2014-2016. Source: authors’ calculation based on Euromonitor data.

Correlation matrix. Source: authors’ calculation based on Euromonitor and World Bank data.
Empirical analysis is carried out on data that have several limitations, such as missing observations, a high difference between the characteristics of countries, but these limitations are not critical for the methods chosen by the authors, regressions on panel data and synthetic control.
Before econometric estimation, propensity score matching was made (
- Log (GDP_per_capita) – natural logarithm for GDP per capita;
- Internet_users – share of internet users;
- Urban - share of urban population;
- Year_i – dummy variable for year after ban lift, where i is number of years after lift (Year_0 – first year, when ban was lifted);
- Dist_trade – dummy variable equal to one, if distance drug trade is allowed;
- Health_exp – share of GDP expenditure on healthcare;
- Pensioners – share of population older than 65;
- Life_exp – Life expectancy.
Matching allows us to overcome endogeneity arising from self-selection problems (e.g., when legalization is introduced to those countries with high market concentration, inflation, low population density), countries from the impact group are compared to countries from the control group with similar characteristics, so similar observations are compared. The variables of interest in this model are Dist_trade variables and Year variables with lags. Lags are added to the models to test, whether the legalization effect is delayed or immediate, and whether it is short or long term. If the coefficients for Year_i and Dist_trade are significant with different signs, then a delayed effect is observed, that is, the influence of electronic commerce increases over the years. If the coefficient for Year_i is significant, while the one for for Dist_trade is not, then the effect is short-term.
The assessment is also carried out using the method of synthetic control.
The essence of the method consists in comparing cases for individual countries under the treatment effect with countries without treatment effect. Technically, the method is needed to create a synthetic copy of the country under study, comparing with it the countries from the control group by selected characteristics (
To estimate the effect of the synthetic control, the sample was drawn from the countries where there was no effect, i.e., those countries where distance selling of drugs was prohibited during the study period. The appendix presents the countries selected for synthetic control. An important limitation of the synthetic control method, given the available data, is that the control countries (except South Korea and Croatia) are underdeveloped, so they may be ill-suited for the synthesis of developed countries. In order to overcome this limitation, only those countries for which the synthetic control fitting turned out to be sufficiently accurate are included in the assessment of the average impact effect. To estimate the quality of the synthetic control we use Fit Index (Adhikari & Alm 2016). Index itself shows how much the estimation obtained by the synthetic control is better than the score in its absence. The closer the index is to 0, the more precise the control is. The 1-FitIndex value provides information similar to that provided by R^2 in regression analysis. The results obtained by the synthetic control are double verified for their reliability. First, those countries are selected for which the fit index is less than 0.1 (similar to the 10% significance level), and then the remaining countries pass a placebo test, the meaning of which is to check whether the effect is the cause of the changes, or the effect is due to the peculiarities of the calculation of the estimate.
One of the sources of endogeneity may be effects associated with the COVID-19 pandemic, which, as mentioned above, was the reason for the legalization of drug e-commerce in several countries. The synthetic control method overcomes this problem by comparing the dynamics of the dependent variable to that of a synthetic clone consisting of countries also affected by the pandemic. In addition, most of the countries studied in this research had legalized e-commerce by 2020.
The drug market is quite specific, its structure is influenced by many factors, for example, the launch of new drugs or the entry of generics into the market. Therefore, to analyze changes in this market, the OTC (over the counter) segment is taken, in which generics prevail and there are no supply shocks like those listed above.
Results
Market concentration
Hypothesis 1: producer concentration is positively related to the share of pensioners in the population of the country, and e-commerce channel decreases market concentration ceteris paribus.
Econometric estimation
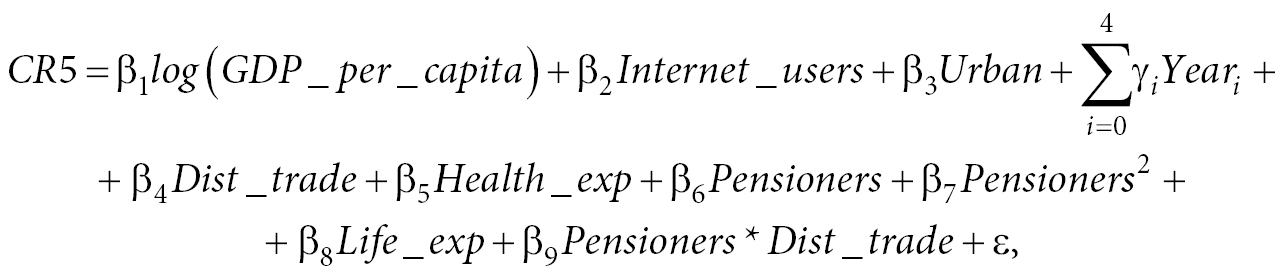
To estimate the influence of e-commerce legalization on market concentration, the values of the coefficients for the variables Dist_trade, Year_i, Pensioners*Dist_trade in this equation are studied:
After model specification tests (Breusch-Pagan, Hausman, Wald test) the fixed effects model has best specification. According to estimation results (Table
The treatment effect was also estimated for concentration of certain medicine brands. More detailed estimation results can be found in the appendix (Table
| CR5 | ||
| FE unmatched | FE matched | |
| Log (GDP_per_capita) | -0.516 | -0.842 |
| (0.666) | (0.647) | |
| Share of internet users | 0.052*** | 0.059*** |
| (0.015) | (0.016) | |
| Share of urban population | 0.494*** | 0.549*** |
| (0.123) | (0.126) | |
| Year_0 | 1.579*** | 1.412*** |
| (0.582) | (0.517) | |
| Year_1 | 1.526*** | 1.465*** |
| (0.553) | (0.475) | |
| Year_2 | 0.954* | 1.063** |
| (0.518) | (0.448) | |
| Year_3 | 0.627 | 0.540 |
| (0.471) | (0.413) | |
| Year_4 | 1.143** | 1.016** |
| (0.453) | (0.405) | |
| Distance trade legalized | 1.122 | 1.168* |
| (0.762) | (0.691) | |
| Health expenditure | -0.030 | -0.004 |
| (0.203) | (0.214) | |
| Share of pensioners | 1.030** | 0.777 |
| (0.474) | (0.515) | |
| Share of pensioners2 | -0.012 | -0.006 |
| (0.013) | (0.015) | |
| Life expectancy | -0.056 | -0.230 |
| (0.213) | (0.228) | |
| Share of pensioners *Distance_trade legalized |
-0.242*** | -0.230*** |
| (0.051) | (0.040) | |
| Observations | 724 | 724 |
| R2 | 0.266 | 0.263 |
| Adjusted R2 | 0.138 | 0.135 |
| F Statistic (df = 14; 616) | 15.917*** | 15.079*** |
| Note: | *p<0.1, **p<0.05, ***p<0.01 | |
Synthetic control estimation
To clarify the hypothesis testing, treatment effect is estimated using synthetic control. For each synthesized country (in total there are 16 synthesized) fit index was calculated. Due to the method limitations described in the beginning of the chapter, those countries whose fit index was less than (the threshold is 0.08)
Placebo tests
To verify results, a placebo test was conducted for each of the synthesized countries: the treatment effect was “shifted” forward and backward for several years. If the change of concentration occurred due to the legalization, the new synthetic control results would be slightly from the original. Thus, out of 6 countries filtered by fit index only 4 remained: Austria, India, Belarus and Ecuador (Fig.
Distance drug trade legalization effect is multidirectional for studied countries. In India the concentration dropped immediately by 1 percentage point and 5 years later the decrease reached 5 percentage points. In Austria the effect was delayed, in first years the concentration increased by 2.5 percentage points and 5 years later it also decreased by 5 percentage points, in Ecuador 3 years after the ban lift concentration decreased by 0.5 percentage points. In Belarus after the ban lift concentration increased by 3 percentage points, but, as the measure was adopted in 2020 it is impossible to estimate the long-term effect. The multidirectional effect can be explained by differences in the institutional environment between countries. For example, the negative effect for Austria can be explained by a greater choice between drug manufacturers (Euromonitor tracks 92 producers) and the population getting access to a larger assortment, while in Ecuador the number of manufacturers available to the population is smaller (50 according to Euromonitor), the involvement in online purchases is lower (about 60% of the population of Ecuador use the Internet, in Austria the figure is up to 89%), which is why the effect of the legalization of online drug trade on the market concentration was estimated to be positive.
We also apply synthetic control to assess concentration of brands. Analogically for each synthesized country fit index was calculated and countries with quality fit (the threshold is 0.08) were filtered out. This leaves 4 countries to calculate the average treatment effect: India, Morocco, Panama, South Africa (Fig.

The effects of distance drug trade legalization on producer concentrations obtained by synthetic control. Source: authors’ calculation based on Euromonitor and World Bank data.

Placebo-tests for producer concentration. Source: authors’ calculation based on Euromonitor and World Bank data.

Placebo tests
To verify the results, a placebo test for each synthesized country was calculated. 3 out of the 4 countries selected by the fit index passed the placebo-test: India, Morocco, South Africa (Fig.

Placebo test for brand concentration. Source: authors’ calculation based on Euromonitor and World Bank data.
In general, with the legalization of online drug trade brand concentration decreases. In India the decrease reached 3 percentage points in the long-term, in Morocco – up to 1 percentage point and in South Africa the decrease is about 1.5 percentage points in the long term. In general, with the legalization of online commerce, the concentration of the most popular drugs is decreasing. Thus, the concentration decreased by 3 p.p. in India, by 1 p.p. in Morocco, and by 1.5 p.p. in South Africa.
Once e-commerce of medicines is legalized, information asymmetry decreases, and the availability of pharmaceuticals form less popular producers increases. This effect can be traced through a decrease in both producer and brand concentration. Customers find new, more suitable drugs and begins to purchase them.
Prices for medicines
Hypothesis 2: Distance trade of medicines reduces the price level in both short and long term.
Econometric estimation
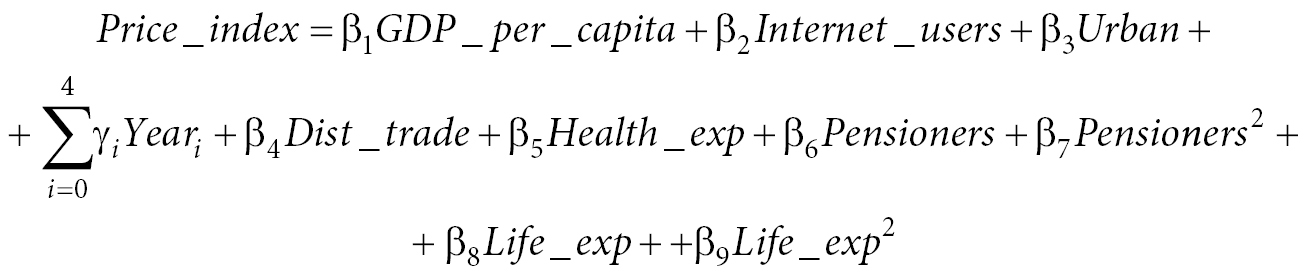
To estimate the effect of e-commerce legalization on market concentration, we consider the values of the coefficients for the variables Dist_trade, Year_i, Pensioners*Dist_trade in the following equation:
After model specification tests the best model is pooling regression. According to the estimation results (Table
Synthetic control estimation
To check the assumption that the legalization of online drug trade slows down the price growth, synthetic control method can be used. For each synthesized country (in total 21 of them) fit index was calculated and, similarly to previous estimations, countries with quality fit (threshold if 0.08) were filtered out. This leaves 15 countries to calculate the average treatment effect (Fig.
| price_index | ||
|---|---|---|
| Pool matched | Pool unmatched | |
| GDP_per_capita) | -0.00000 | -0.00000 |
| (0.00000) | (0.00000) | |
| Share of internet users | -0.0002 | -0.0002 |
| (0.0002) | (0.0002) | |
| Share of urban population | 0.001*** | 0.001*** |
| (0.0002) | (0.0002) | |
| Year_0 | -0.019 | -0.019 |
| (0.013) | (0.018) | |
| Year_1 | -0.010 | -0.012 |
| (0.012) | (0.016) | |
| Year_2 | 0.006 | 0.005 |
| (0.012) | (0.016) | |
| Year_3 | 0.005 | 0.005 |
| (0.011) | (0.016) | |
| Year_4 | -0.004 | -0.005 |
| (0.012) | (0.017) | |
| Distance trade legalized | -0.014** | -0.007 |
| (0.007) | (0.008) | |
| Health expenditure | 0.001 | -0.001 |
| (0.001) | (0.001) | |
| Share of pensioners | 0.006 | 0.016*** |
| (0.004) | (0.004) | |
| Share of pensioners2 | -0.0003* | -0.001*** |
| (0.0002) | (0.0001) | |
| Life expectancy | 0.038** | 0.025*** |
| (0.018) | (0.009) | |
| Life expectancy2 | -0.0003** | -0.0002*** |
| (0.0001) | (0.0001) | |
| Constant | -0.217 | 0.246 |
| (0.669) | (0.310) | |
| Observations | 616 | 616 |
| R2 | 0.122 | 0.144 |
| Adjusted R2 | 0.102 | 0.124 |
| F Statistic (df = 14; 601) | 10.230*** | 7.208*** |
| Note: | *p<0.1, **p<0.05, ***p<0.01 | |

Placebo tests
To verify the results placebo tests were conducted. Out of 15 countries only 6 passed the placebo test: Bangladesh, Bolivia, Chile, Finland, India, Morocco (Fig.
It is worth noting that, even though the visual dynamics for Morocco and Chile are different, the Fit Index value is less than 0.08, and the placebo test is passed. The legalization effect for studied countries is heterogenous. Among countries that lifted online drug trade ban before 2017 medical goods inflation slowed down in Chile (by 0.1 percentage points), Bolivia (by 5 percentage points), Finland (by 0.5 percentage points) and in Morocco (by 2 percentage points). In India, however, the inflation accelerated, approximately by 4 percentage points, and in Bangladesh – by 2.5 percentage points. The heterogeneity of the effect, as in the case of market concentration, may be due to differences in the institutional environment and infrastructure of countries (both countries are developing, but Bolivia is at a higher stage of development, in India’s GDP growth is 7-8% per year, while Bolivia’s is 4-5%, and the urbanization rate in India half that of Bolivia, 35% and 70% respectively). Drug inflation depends on many factors, which in turn determine the direction of the effect. However, as can be seen from the estimates obtained by synthetic control and panel data models, the effect of the legalization of online drug trade on the price index is negative in most cases.
As mentioned before, information asymmetry decreases with online drug trade legalization, the population receives more information about goods and their value. As a result, price competition increases, and the prices for medicines in different pharmacies flat out.

Comparing prices in border cities with different online drug trade policies
In addition to econometric methods, the legalization effect can be estimated by direct comparison of prices in pharmacies in cities near borders of countries with different online trade policies. The paper compares exactly the prices in permitting prescription trade for several reasons. First, you can only get information about the price of a particular drug if you can buy it
The list of chosen medicines and links to the pharmacy websites can be found in the appendix (Table
The difference and the ratio of prices are compared. As can be seen (Fig.

The difference (right) and ratio (left) of the price of medicines in countries where prescription trade is prohibited and allowed. Source: authors’ calculations based on the collected data on drug prices. The red dotted line indicates a ratio equal to 1 and a difference equal to 0.
However, the difference in prices varies a lot depending on the category. Medicines were collected in 6 groups:
- Sore throat, flu, nasal, n = 22;
- Allergies, eyes, n = 16;
- Intestines, laxatives, digestives, oral, n = 26;
- Analgesic, headache, n = 16;
- Blood circulation, sugar, pressure, n = 16;
- Antidepressants, hypnotics, sedatives, n = 8.
This method has several limitations. While there are enough variables (n = 126) to compare drugs in all categories together, there are not many to compare them in individual categories. It is also worth noting that in the category “Analgesic, headache” and “Antidepressants, hypnotics, sedatives” there are predominantly non-prescription medicines, sample doesn’t include strong painkillers and antidepressants acting as narcotics were not included due to the lack of public information about their price in the countries with prohibited online sale of prescription drugs.
Fig.
The differences in categories can be explained by different policies regarding prescription drugs. For example, in Paraguay
The obtained estimates indicate that with online medicine trade legalization prices decrease. Opening new sales channel decrease information asymmetry, as a result of which the prices of medicines are smoothed out.
Legalizing online sales of prescription drugs has a particular impact on price. With the lifting of the ban, prices go down, and in categories where the proportion of prescription drugs is high, the decline is greater. However, this conclusion is formulated at the level of a hypothesis and requires verification in further studies.

Conclusions
In general, the hypotheses are partially confirmed. Hypothesis 1 about the decrease in market concentration with lifting online drug trade ban is confirmed. Based on estimates the manufacturer concentration decreases, plus the higher share of pensioners the greater decrease.
Hypothesis 2 about price level decrease is confirmed partially. Based on econometric estimation prices are reducing. However, regarding the quality of data and constructed models it can only be stated that medical goods inflation slows down. Besides, comparing border cities it can be concluded that with legalizing online prescription drug trade prices decrease more in categories with the higher share of prescription pharmaceuticals.
Empirical estimations obtained in previous sections allow to formulate an overall picture of the consequences of online drug trade legalization. After the ban lift a new sales channel opens. Its formation takes several years, during which short term effects appear. Consumers start purchasing the medicines they got used to, which leads to increase in brand concentration. The information asymmetry gradually decreases, as a result, price growth slows down and prices for some drugs are likely to decrease.
4 years after distance trade legalization the market is formed, and long-term effects start taking place. The generic manufacturers (smaller producers out of the 5 biggest firms) enter the market, concentration of brands drops and returns to its previous values. Producer concentration, in turn, starts going down, as consumers get more information about the drugs on the market and choose drugs that are more suitable for them. Drug prices continue to rise, but the rate of increase is lower than before the ban lift.
The limitations of this study are the low quality of some data used
For further research in the field of e-commerce it is possible to study the impact on geographic boundaries of the market, namely, to analyze shares of foreign producers before and after the e-commerce drug legalization. Finally, with more detailed database of manufacturers and drugs
List of references
- Abadie A (2021) Using synthetic controls: Feasibility, data requirements, and methodological aspects. Journal of Economic Literature 59(2): 391–425. https://doi.org/10.1257/jel.20191450
- Adhikari B, Alm J (2016) Evaluating the economic effects of flat tax reforms using synthetic control methods. Southern Economic Journal 83(2): 437–63. https://doi.org/10.1002/soej.12152
- Arentz O, Recker C, Vuong VA, Wambach A (2016) Entry in German pharmacy market / Otto-Wolff-Discussion Paper: 2. URL: https://www.econstor.eu/bitstream/10419/145984/1/852496737.pdf
- Cárdenas I, Beckers J, Vanelslander T (2017) E-commerce last-mile in Belgium : Developing an external cost delivery index. Research in Transportation Business & Management 24: 123–29. https://doi.org/10.1016/j.rtbm.2017.07.006
- Cavallo A (2017) Are online and offline prices similar? Evidence from large multi-channel retailers. American Economic Review 107(1): 283–303. https://doi.org/10.1257/aer.20160542
- Cîrstea SD, Moldovan-Teselios C, Iancu AI (2017) Analysis of factors that influence OTC purchasing behavior. In: Vlad S, Roman N (eds) International Conference on Advancements of Medicine and Health Care through Technology, Cluj-Napoca (Romania), October 2016. IFMBE Proceedings: 59. Springer, Cham, 303–8. https://doi.org/10.1007/978-3-319-52875-5_63
- Craig AM, Malek M (1995) Market structure and conduct in the pharmaceutical industry. Pharmacology and Therapeutics 66(2): 301–37. https://doi.org/10.1016/0163-7258(95)00002-X
- Dave CV, Kesselheim AS, Fox ER, Qiu P, Hartzema A (2017) High generic drug prices and market competition: A retrospective cohort study. Annals of Internal Medicine 167(3): 145–51. https://doi.org/10.7326/M16-1432
- Davis P, Garcés E (2010) Quantitative Techniques for Competition and Antitrust Analysis: Princeton University Press. URL: https://www.jstor.org/stable/j.ctt7sqz9
- Duijmelinck D, Van de Ven W (2016) Switching rates in health insurance markets decrease with age: Empirical evidence and policy implications from the Netherlands. Health Economics, Policy and Law 11(2): 141–59. https://doi.org/10.1017/S1744133115000328
- Freebairn J (2001) Some market effects of E-commerce. The Singapore Economic Review 46(1): 49–62. https://doi.org/10.1142/S0217590801000231
- Goldmanis M, Hortaçsu A, Syverson C, Emre Ö (2010) E-Commerce and the Market Structure of Retail Industries. The Economic Journal 120(545): 651–82. https://doi.org/10.1111/j.1468-0297.2009.02310.x
- Kiser EK (2002) Household Switching Behavior at Depository Institutions: Evidence from Survey Data. The Antitrust Bulletin: 47(4): 619–40. https://doi.org/10.1177/0003603X0204700404
- Lola I, Bakeev M (2021) What determines the differentiation in the e-commerce adoption by consumers: evidence from Russia. Electronic Commerce Research. https://doi.org/10.1007/s10660-021-09507-7
- Lucero Ortiz A, Rodríguez JC, Gómez M (2020) E-commerce development in Europe: A panel data analysis 2003–2017. E&M Economics and Management 23(4): 89–101. https://doi.org/10.15240/tul/001/2020-4-006
- Martínez-Domínguez M, Mora-Rivera J (2020) Internet adoption and usage patterns in rural Mexico. Technology in Society 60: 101226. https://doi.org/10.1016/j.techsoc.2019.101226
- Mavlanova T, Benbunan-Fich R, Koufaris M (2012) Signaling theory and information asymmetry in online commerce. Information and Management 49(5): 240–47. https://doi.org/10.1016/j.im.2012.05.004
- Rosenbaum P (2006) The central role of the propensity score in observational studies for causal effects. In: DB Rubin (Author) Matched Sampling for Causal Effects. Cambridge University Press, Cambridge. P.170–84. https://doi.org/10.1017/CBO9780511810725.016
- Shastitko AE, Pavlova NS (2017) Bargaining power and market power: Comparison and policy implications. Journal of the New Economic Association 2(34): 39–57. URL: http://journal.econorus.org/pdf/NEA-34.pdf (in Russian)
- Zhang XL, Demirkan H (2021) Between online and offline markets: A structural estimation of consumer demand // Information and Management: 58(4): 103467. https://doi.org/10.1016/j.im.2021.103467
- Anvisa (2022) Brazilian National Health Surveillance Agency, list of prescription drugs. URL: https://www.gov.br/anvisa/pt-br/setorregulado/regularizacao/medicamentos/medicamentos-de-referencia/lista-de-medicamentos-de-referencia (accessed on: 07.04.2022)
- Euromonitor International (2022) https://www.portal.euromonitor.com/
- MSPBS, Ministry of Public Health and Social Welfare of Paraguay, list of medicines. URL: https://www.mspbs.gov.py/dependencias/dggies/adjunto/db7bee-ListadodeMedicamentosEsenciales.pdf (accessed on: 07.04.2022)
- Numbeo (2022) Cost of Living Index by Country. URL: https://www.numbeo.com/cost-of-living/rankings_by_country.jsp (accessed on: 09.04.2022)
- Statista (2022) Online Pharmacy. URL: https://www.statista.com/outlook/dmo/digital-health/ehealth/online-pharmacy/worldwide#revenue
- Zwass V (2022) e-commerce. Encyclopedia Britannica. URL: https://www.britannica.com/technology/e-commerce
Appendix
List of collected variables:
- drug market volume;
- market distribution by sales channels;
- the share of manufacturing companies in the drug market;
- market share of drugs;
- drug price indices and medical services;
- share of population using the Internet;
- GDP per capita;
- share of the urban population in the total population of the country;
- share of pensioners in the country’s population;
- life expectancy;
- the share of obese people in the country’s population;
- the share of the population that consumes alcohol;
- the share of health care expenditures in GDP.
Prior to evaluation, control variables were tested for multicollinearity using the VIF coefficient (Variance Inflation Factor). As can be seen (Table
Visited online-pharmacies:
- Belgium: https://pharmacy-medi-market.be/pharmacie (Antwerp)
- Netherlands: https://www.efarma.nl/
- Germany: https://www.elsass-apotheke.de/ (Aachen), https://www.centralapotheke-online.de/ (Munich), https://medikamente.apotheken.de/ (Saarbrücken), https://www.tablettenshop24.de/ (Dresden), https://apo2u.com/ (Flensburg)
- France: https://pharmacy-medi-market.be/ (Metz)
- Austria: https://www.servusapotheke.at/ (all over Austria)
- Sweden: https://www.apoteket.se/ (all over Sweden)
- Finland: https://www.yliopistonapteekki.fi/ (throughout Finland)
- Czech Republic: https://www.benu.cz/ (Usti nad Labem)
- Denmark: https://www.webapoteket.dk/ (Kolding)
- Brazil: https://www.drogaraia.com.br/ (Cascawell)
- Paraguay: https://www.puntofarma.com.py (Ciudad Del Este)
| GVIF | Df | GVIF^(1/(2*Df)) | |
|---|---|---|---|
| Log (GDP_per_capita) | 6.24 | 1.00 | 2.50 |
| Internet_users | 4.56 | 1.00 | 2.14 |
| Urban | 2.76 | 1.00 | 1.66 |
| factor(Year) | 1.41 | 5.00 | 1.04 |
| Dist_trade | 2.00 | 1.00 | 1.42 |
| Health_exp | 2.24 | 1.00 | 1.50 |
| Pensioners | 2.89 | 1.00 | 1.70 |
| Life_exp | 3.23 | 1.00 | 1.80 |
| 1. Algeria | 2. Ghana | 3. Oman |
| 4. Angola | 5. Guatemala | 6. Paraguay |
| 7. Argentina | 8. Honduras | 9. Philippines |
| 10. Azerbaijan | 11. Iraq | 12. Serbia |
| 13. Bosnia and Herzegovina | 14. Jordan | 15. South Korea |
| 16. Cambodia | 17. Kenya | 18. Tanzania |
| 19. Cameroon | 20. Laos | 21. Thailand |
| 22. Cote d’Ivoire | 23. Lebanon | 24. Tunisia |
| 25. Croatia | 26. Myanmar | 27. Uzbekistan |
| 28. El Salvador | 29. Nigeria | 30. Vietnam |
| 31. Ethiopia |
| brand_CR5 | ||||
|---|---|---|---|---|
| Pool matched | Pool unmatched | FE matched | FE unmatched | |
| (1) | (2) | (3) | (4) | |
| Log (GDP_per_capita) | -4.898*** | -3.709*** | 0.331 | 0.313 |
| (0.529) | (0.507) | (0.295) | (0.310) | |
| Share of internet users | -0.075*** | -0.019 | 0.008 | 0.016** |
| (0.020) | (0.020) | (0.008) | (0.007) | |
| Share of urban population | 0.089*** | 0.118*** | -0.072 | -0.083 |
| (0.023) | (0.021) | (0.059) | (0.057) | |
| Year_0 | -1.666 | 1.030 | 0.388 | 0.235 |
| (1.272) | (1.454) | (0.249) | (0.270) | |
| Year_1 | 0.004 | 1.231 | 0.467** | 0.443* |
| (1.110) | (1.428) | (0.221) | (0.257) | |
| Year_2 | 0.151 | 1.098 | 0.392* | 0.264 |
| (1.103) | (1.375) | (0.207) | (0.241) | |
| Year_3 | -0.212 | 0.469 | 0.475** | 0.377* |
| (1.112) | (1.325) | (0.190) | (0.219) | |
| Year_4 | -0.280 | 0.102 | 0.529*** | 0.270 |
| (1.159) | (1.342) | (0.185) | (0.211) | |
| Distance trade legalized | -0.295 | -2.587* | -0.678** | -0.589* |
| (1.188) | (1.346) | (0.323) | (0.354) | |
| Health expenditure | 0.276* | 0.406*** | 0.311*** | 0.143 |
| (0.146) | (0.140) | (0.103) | (0.094) | |
| Share of pensioners | 1.036*** | 1.326*** | -0.531** | -0.390* |
| (0.209) | (0.197) | (0.246) | (0.220) | |
| Share of pensioners2 | -0.051*** | -0.055*** | 0.003 | 0.001 |
| (0.009) | (0.008) | (0.007) | (0.006) | |
| Share of pensioners *Distance_trade legalized | 0.094 | 0.024 | 0.041** | 0.033 |
| (0.089) | (0.105) | (0.018) | (0.024) | |
| Life expectancy | 0.674*** | 0.245*** | 0.653*** | 0.537*** |
| (0.074) | (0.072) | (0.112) | (0.099) | |
| Constant | 4.044 | 18.000*** | ||
| (4.713) | (4.403) | |||
| Observations | 724 | 724 | 724 | 724 |
| R2 | 0.189 | 0.239 | 0.113 | 0.121 |
| Adjusted R2 | 0.173 | 0.224 | -0.041 | -0.032 |
| F Statistic | 32.598*** (df = 14; 709) | 15.922*** (df = 14; 709) | 6.892*** (df = 14; 616) | 6.036*** (df = 14; 616) |
| Note: | *p**p***p<0.01 | |||
| Medicine name | Category | Countries | Medicine name | Category | Countries | |
|---|---|---|---|---|---|---|
| 1 | Nurofen | Sore throat | BEL_NET | Oxalate | Antidepressant | PAR_BRA |
| 2 | Cetrizine | Allergy | BEL_NET | Mirtazapine | Antidepressant | PAR_BRA |
| 3 | Zyrtec | Allergy | BEL_NET | Valdispert | Hypnotic | BEL_NET |
| 4 | Tempocol | Intestines | BEL_NET | Rennie | Digestive | BEL_NET |
| 5 | Gaviscon | Digestive | BEL_NET | Forlax | Digestive | BEL_NET |
| 6 | Creon | Digestive | BEL_NET | Imodium | Digestive | BEL_NET |
| 7 | Fucithalmic | Eyes | BEL_NET | A.Vogel | Sore throat | BEL_NET |
| 8 | Benzac | Dermatology | BEL_NET | Strepsils | Sore throat | BEL_NET |
| 9 | Physiomer | Flu | BEL_NET | Otrivin | Nasal | BEL_NET |
| 10 | Xylocaine | Painkiller | BEL_NET | Corsodyl | Dental | BEL_NET |
| 11 | Instillagel | Painkiller | BEL_NET | Voltaren | Painkiller | BEL_NET |
| 12 | Bisadoyl | Laxative | BEL_NET | Allergo Comod | Allergy | BEL_NET |
| 13 | Moviprep | Laxative | BEL_NET | Loratadine | Allergy | BEL_NET |
| 14 | Baxter NaCl | Insulin | BEL_NET | Spidifen | Headache | BEL_NET |
| 15 | Nurofen | Sore throat | BEL_GER | Curaspot/ Benzacnen | Dermatology | FRA_GER |
| 16 | Xylocaine | Painkiller | BEL_GER | Duofilm | Dermatology | FRA_GER |
| 17 | Instillagel | Painkiller | BEL_GER | Lercadipine | Pressure | PAR_BRA |
| 18 | Moviprep | Laxative | BEL_GER | Alopurinol | Digestive | PAR_BRA |
| 19 | Corsodyl | Dental | BEL_GER | Praroxetine | Antidepressant | PAR_BRA |
| 20 | Gaviscon | Digestive | BEL_GER | Pradaxa | Blood | PAR_BRA |
| 21 | Cinnarizine | Blood | BEL_GER | Temisartan | Pressure | PAR_BRA |
| 22 | Zaffranax | Antidepressant | BEL_GER | Nebivolol | Pressure | PAR_BRA |
| 23 | Strepsils/Dolo Dobendan | Sore throat | FRA_GER | Levetiracetam | Antiepileptic | PAR_BRA |
| 24 | Aspirin | Headache | FRA_GER | Rivaroxaban | Blood | PAR_BRA |
| 25 | Pyralvex | Oral | FRA_GER | Tadalafil | Intime | PAR_BRA |
| 26 | Alka Seltzer | Headache | FRA_GER | L Arginin | Pressure | AUS_GER |
| 27 | Gaviscon | Digestive | FRA_GER | Microlax | Intestines | AUS_GER |
| 28 | Curaspot | Eyes | FRA_GER | Iberogast | Intestines | AUS_GER |
| 29 | Korodin | Blood | AUS_GER | Lactostop | Intestines | AUS_GER |
| 30 | Antistax | Blood | AUS_GER | Buscopan | Digestive | AUS_GER |
| 31 | Hylo-Komod | Eyes | AUS_GER | Neurexan | Hypnotic | AUS_GER |
| 32 | Femannose | Kidneys | AUS_GER | Orthomol | Dermatology | AUS_GER |
| 33 | Fenistil | Allergy | AUS_GER | Systane | Eyes | DEN_GER |
| 34 | Fenistil | Allergy | AUS_GER | Strepsils/Dolo Dobendan | Sore throat | DEN_GER |
| 35 | Hoggar | Hypnotic | AUS_GER | Imodium | Digestive | DEN_GER |
| 36 | Lasea | Hypnotic | AUS_GER | Movicol | Digestive | DEN_GER |
| 37 | Emser | Flu | AUS_GER | Voltaren | Painkiller | DEN_GER |
| 38 | Grippostad | Flu | AUS_GER | Daosin | Allergy | DEN_GER |
| 39 | Aspirin | Headache | AUS_GER | Telfast | Allergy | DEN_GER |
| 40 | Bepanthen | Dermatology | AUS_GER | A.Vogel | Sore throat | DEN_GER |
| 41 | Strepsils | Sore throat | SWE_FIN | Hirudoid | Blood | DEN_GER |
| 42 | Bafucin | Sore throat | SWE_FIN | Otrivin | Nasal | DEN_GER |
| 43 | Ibumax | Flu | SWE_FIN | Sinupret | Nasal | DEN_GER |
| 44 | Physiomer | Flu | SWE_FIN | Gelo Revoice | Sore throat | DEN_GER |
| 45 | Dymista | Flu | SWE_FIN | Prolacsan | Dental | DEN_GER |
| 46 | Itulazax | Allergy | SWE_FIN | Corsodyl | Dental | DEN_GER |
| 47 | Slinda | Contraception | SWE_FIN | Ibutop | Painkiller | DEN_GER |
| 48 | Asacol | Intestines | SWE_FIN | Istillagel | Painkiller | DEN_GER |
| 49 | Priorin | Hair | SWE_FIN | Laxoberal | Laxative | DEN_GER |
| 50 | Vagiscan | Intime | SWE_FIN | Bepanthen | Dermatology | DEN_GER |
| 51 | Arthrotec | Arthritis | SWE_FIN | Canesten | Intime | DEN_GER |
| 52 | Kaleorid | Blood | SWE_FIN | Fenistil | Allergy | CZE_GER |
| 53 | Sideral | Maternity | SWE_FIN | Rennie | Digestive | CZE_GER |
| 54 | Apracur | Flu | PAR_BRA | Imodium | Digestive | CZE_GER |
| 55 | Enterogermina | Digestive | PAR_BRA | Aspirin | Painkiller | CZE_GER |
| 56 | Tamsulon | Intime | PAR_BRA | Venoruton | Blood | CZE_GER |
| 57 | Xarelto | Blood | PAR_BRA | Hylo gel | Eyes | CZE_GER |
| 58 | Piascledin | Bones and joints | PAR_BRA | Hylo-Komod | Eyes | CZE_GER |
| 59 | Buscopan | Anti-inflammatory | PAR_BRA | Lactulose | Intestines | CZE_GER |
| 60 | Micardis | Pressure | PAR_BRA | Voltaren | Painkiller | CZE_GER |
| 61 | Atorvastina | Blood | PAR_BRA | Otrivin | Nasal | CZE_GER |
| 62 | Duphalac | Digestive | PAR_BRA | Nasivin | Nasal | CZE_GER |
| 63 | Cefalexina | Antibiotic | PAR_BRA | Bromhexin | Flu | CZE_GER |
Information about the authors
Spektor Stanislav Viktorovich — Analyst at the Consumer market development Center, Faculty of Economics, M. V. Lomonosov Moscow State University, Moscow, 119991, Russia. Email: spektor@econ.msu.ru
Ionkina Karina Alexandrovna — Researcher, Competition and Industrial Policy Department, Faculty of Economics, M. V. Lomonosov Moscow State University, Moscow, 119991, Russia, Junior Researcher, Center for Competition and Economic Regulation Research, RANEPA, Moscow, 119571, Russia. Email: kaionkina@econ.msu.ru